
Figure 3.
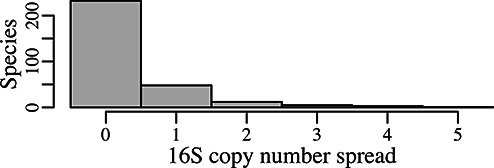
Histogram showing 16S copy number variability in 301 species aggregates of the rrnDB records. Only species that are represented by at least two records are counted in this display. Fully 77% of the species show zero variance in 16S gene copy number count among the comprising records. Sixteen percent of the species vary by only one copy, and only 3% of species show a copy number spread of three or more.