
Figure 2.
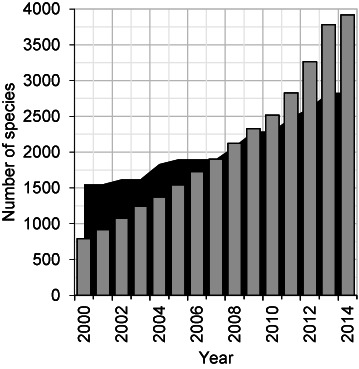
Number of ICTV species and viral RefSeq genomes. The numbers of viral species in the NCBI Taxonomy database that are represented by a RefSeq genome record are depicted by the gray bars, and the number of viral species recognized by the ICTV by the black area. Data was calculated at the end of each year from 2000 to 2014, except for 2014 when data was calculated on September 15. The number of ICTV recognized viral species for each year shown was derived from http://www.ictvonline.org/taxonomyReleases.asp.