
Figure 6.
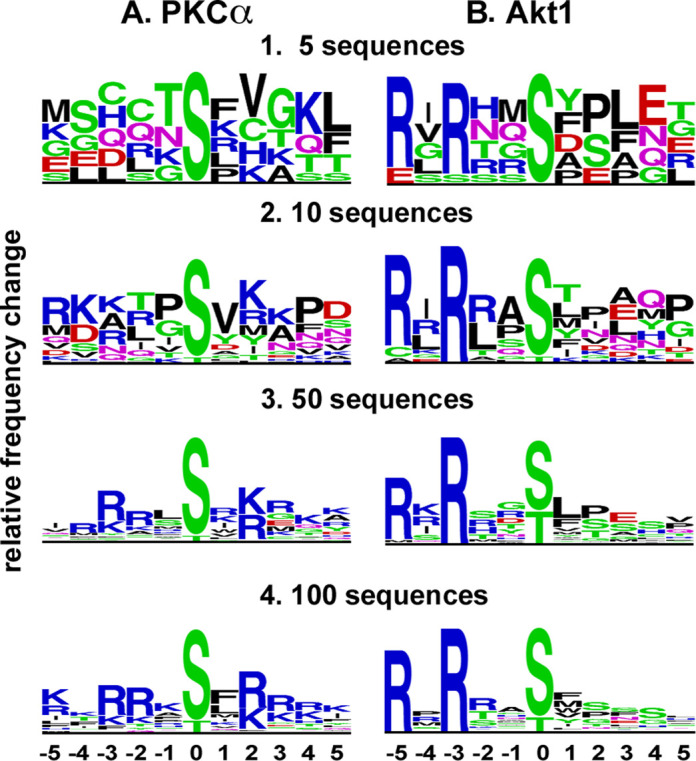
Sequence logos generated using increasing numbers of input sequences. At 5 input Akt sequences, the dominance of R at −3 and −5 was already evident. The preference of PKCα for R or K at +2 was evident using 10 input sequences, but the preference for R at −2 and −3 required between 10 and 50 input sequences. Logos were generated using the Frequency Change algorithm at http://www.phosphosite.org/sequenceLogoAction.do.