


Figure 2.
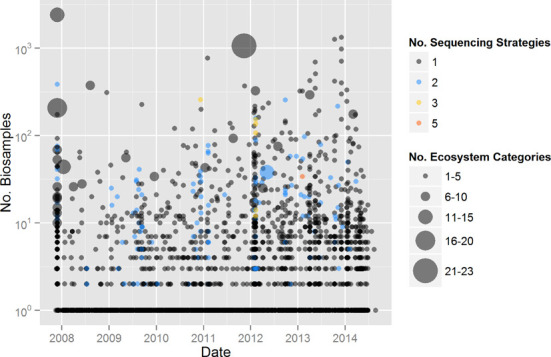
Study Biosamples, ecosystem categories and sequencing strategies. Each point is a GOLD study. The size of the point represents the number of ecosystem categories within a Study. The position on the y-axis denotes the number of Biosamples within a Study. The color of each point indicates the number of unique sequencing strategies used within a Study.