
Figure 3.
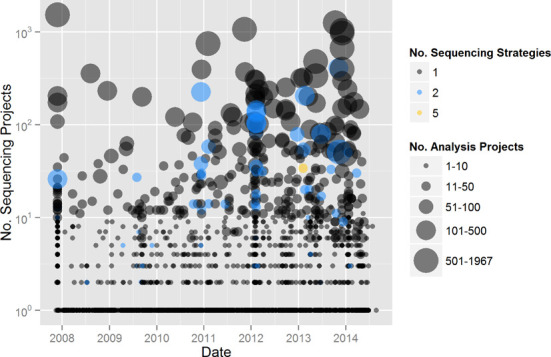
Sequencing and analysis projects per Study over time. Color denotes the number of sequencing strategies used within a Study. The size of the point indicates the number of analysis projects within a Study.
Official websites use .gov
A
.gov website belongs to an official
government organization in the United States.
Secure .gov websites use HTTPS
A lock (
) or https:// means you've safely
connected to the .gov website. Share sensitive
information only on official, secure websites.
Sequencing and analysis projects per Study over time. Color denotes the number of sequencing strategies used within a Study. The size of the point indicates the number of analysis projects within a Study.