
Figure 1.
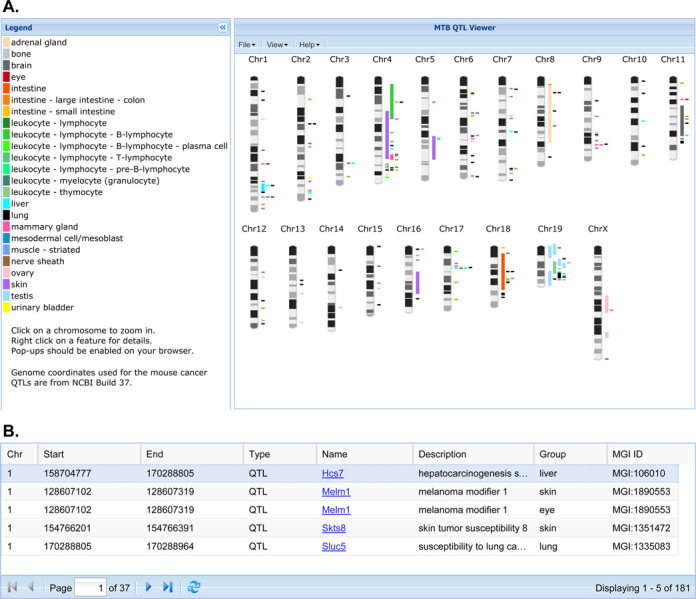
(A) Screenshot of MTB's Cancer QTL Viewer showing the display of all annotated cancer QTL regions for the laboratory mouse displayed in genome context. (B) Links to QTL Detail pages in the MGI database.
Official websites use .gov
A
.gov website belongs to an official
government organization in the United States.
Secure .gov websites use HTTPS
A lock (
) or https:// means you've safely
connected to the .gov website. Share sensitive
information only on official, secure websites.
(A) Screenshot of MTB's Cancer QTL Viewer showing the display of all annotated cancer QTL regions for the laboratory mouse displayed in genome context. (B) Links to QTL Detail pages in the MGI database.