Figure 3.

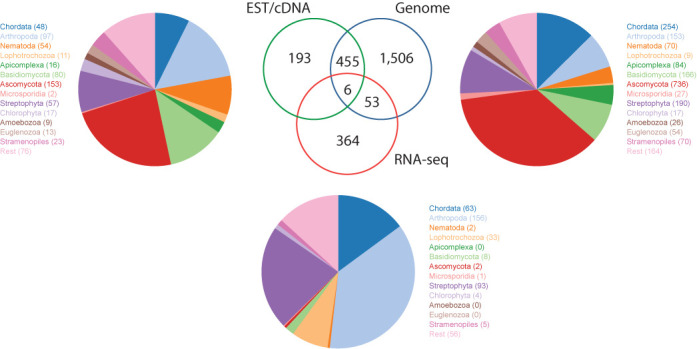
Distribution of species, for which EST/cDNA data, genome assemblies and transcriptome assemblies are available. For each sequencing type, the pie charts show the percentage of sequenced species for selected taxa.

Distribution of species, for which EST/cDNA data, genome assemblies and transcriptome assemblies are available. For each sequencing type, the pie charts show the percentage of sequenced species for selected taxa.