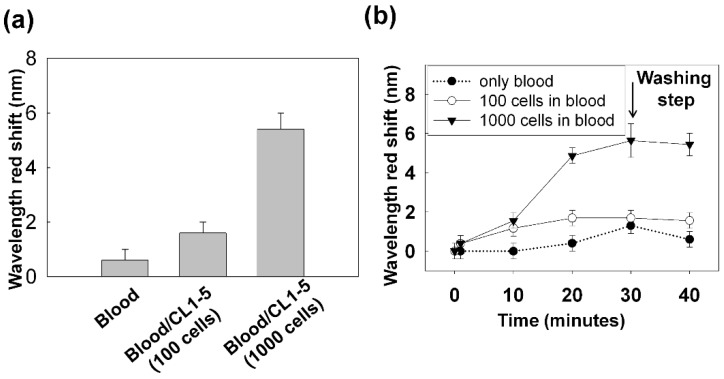
Figure 4.
(a) DCM was applied to 1 mL of blood sample spiked with CL1-5 cells. The SPR response at 40 min for the blood sample without the spiked cells and the blood sample spiked with 100 and 1000 cells are shown. (b) The temporal SPR response that indicates the progression of the cell capturing on the gold nanoslits. Sample was introduced to the chip within 30 min. At 30 min, PBS buffer as the washing buffer was introduced. Each data set is the average of two or three measurements. The error bars lengths have been set to either the measurement standard deviation or the spectrometer resolution (±0.4 nm) whichever is larger.

