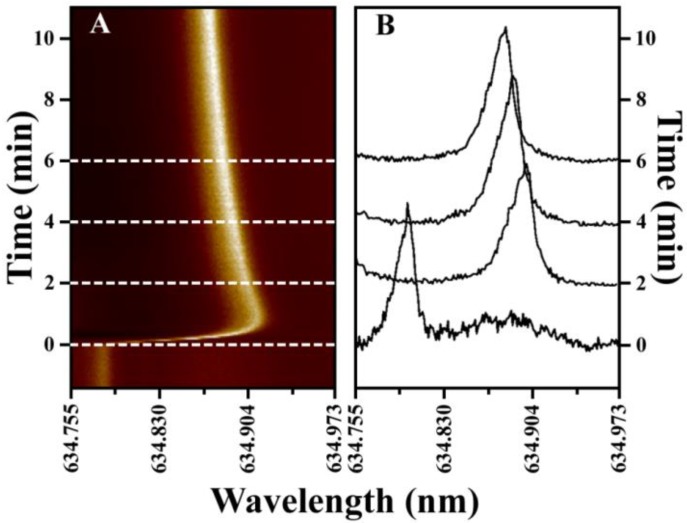
Figure 3.
(A) Waterfall plot showing the time evolution in the WGM resonance of a 38 μm diameter barium-titanate resonator in a 100 μL water droplet. At time zero, a 10 μL spike of saline solution (ΔRIU = +0.002) is quickly injected into the droplet, elevating the refractive index and red-shifting the WGM resonance. The WGM resonance relaxes towards a new equilibrium position as convective mixing in the sessile droplet equilibrates the solution. (B) Selective line cuts from the waterfall plot show the time evolution in the WGM resonance following saline injection. The measured Q-factor is 3.0 × 10⁴.

