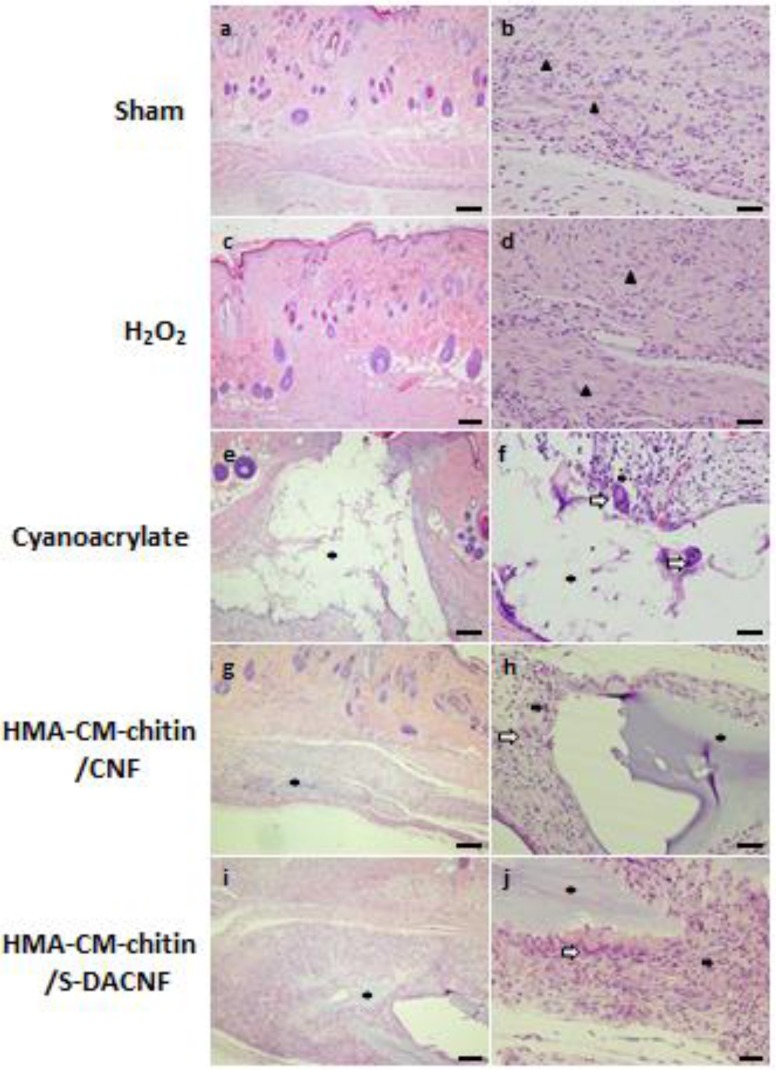
Figure 10.
Histopathological changes. All images are from one of six rats in each group on day 14. The arrows indicate neutrophils. The arrowheads indicate fibroblasts. The asterisks indicate the adhesions. The clear arrows indicate multinucleated giant cells. Results on the low power fields (a,c,e,g,i) and high power fields (b,d,f,h,j) are shown. Scale bar: 200 mm (a,c,e,g,i) and 40 mm (b,d,f,h,j). Copyright 2015 Elsevier [177].

