. 2015 Jan 29;4(2):494–507. doi: 10.1039/c4tx00160e

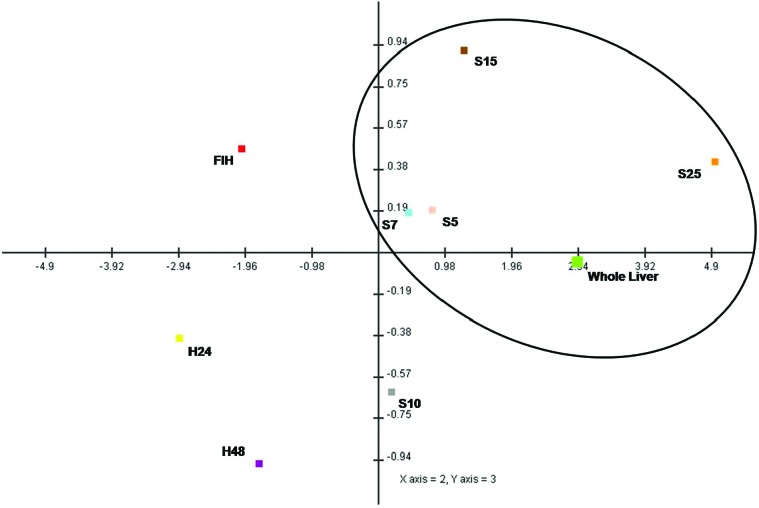
Fig. 6. Principal components analysis (PCA) scores plot for the profile of expression of genes related to xenobiotic efflux in whole liver and all hepatocyte preparations. The plot shows separation of in vivo and in vitro preparations along the PC2 and PC3 axes. There was a clear separation of hepatocytes in monolayer culture at the greatest extreme (bottom left quadrant) from the whole liver sample. In comparison, the expression profile of freshly isolated hepatocytes was closer to that of the whole liver than to the other conventional cell culture types. Variability existed in the expression profile of spheroid hepatocytes according to stage of culture, however, spheroids at all time points displayed a better resemblance to the expression profile of the whole liver. Spheroid hepatocytes 5, 7 and 25 days post isolation showed the best similarity to the expression profile in vivo. FIH: freshly isolated hepatocytes; H24: monolayer culture 24 hpi; H48: monolayer culture 48 hpi; S5: spheroid culture 5 dpi; S7: spheroid culture 7 dpi; S10: spheroid culture 10 dpi; S15: spheroid culture 15 dpi; S25: spheroid culture 25 dpi.

Fig. 6