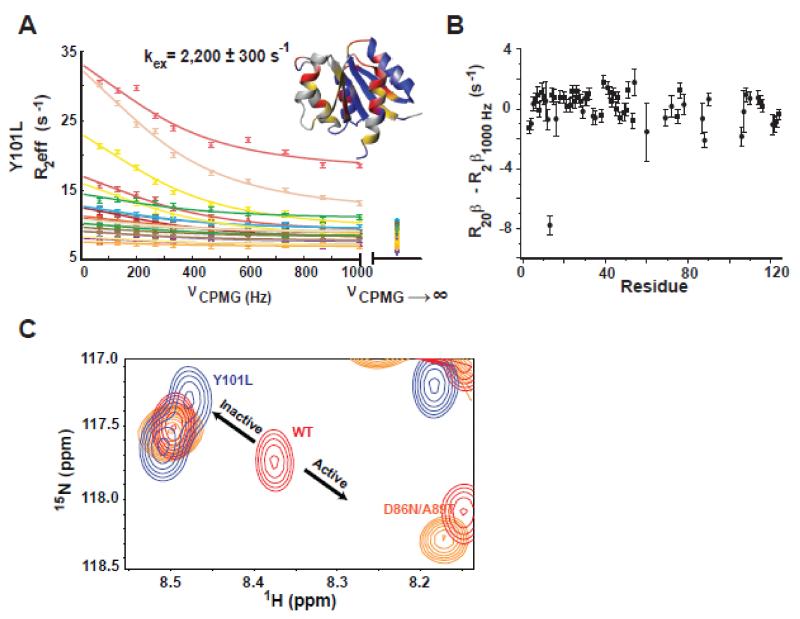
Figure 2. Y101L mutant corroborates that the faster dynamic process is due to rotamer exchange.
A) 15N-CPMG relaxation dispersion profiles for the Y101L NtrCR mutant. Residues whose dispersion was fit globally to the fast form of the Carver-Richards equation in order to determine the rate of exchange (kex) between the inactive and active forms of the protein are shown on the structure (1DC7) in red. Yellow denotes residues whose peaks are severely exchanged broadened, residues that are flat/non-exchanging are colored in blue, and unassigned/proline/overlapped residues are in gray. Dispersion data is color coded as follows: 12 (slate), 13 (pink), 16 (rose), 30 (purple), 40 (dark grey), 41 (light orange), 54 (maroon), 60 (yellow), 68 (light pink), 78 (cyan), 87 (yellow), 88 (orange), 106 (green), 107 (dark green), 108 (olive), 110 (light yellow), 114 (tan), 115 (light green). Importantly, exchange contributions to R2eff are mostly suppressed by the applied CPMG field strength, illustrated by the difference between the exchange free transverse relaxation rates determined independently (R20β at νCPMG→∞) and from 15N-CPMG dispersion experiments (R2β1000Hz) (B). C) The Y101L mutation (blue) shifts the inactive/active state equilibrium toward the inactive state compared to WT (red) as highlighted in the 15N-HSQC overlay for residue 88. The 50% active D86N/A89T mutation is shown in orange for comparison.

