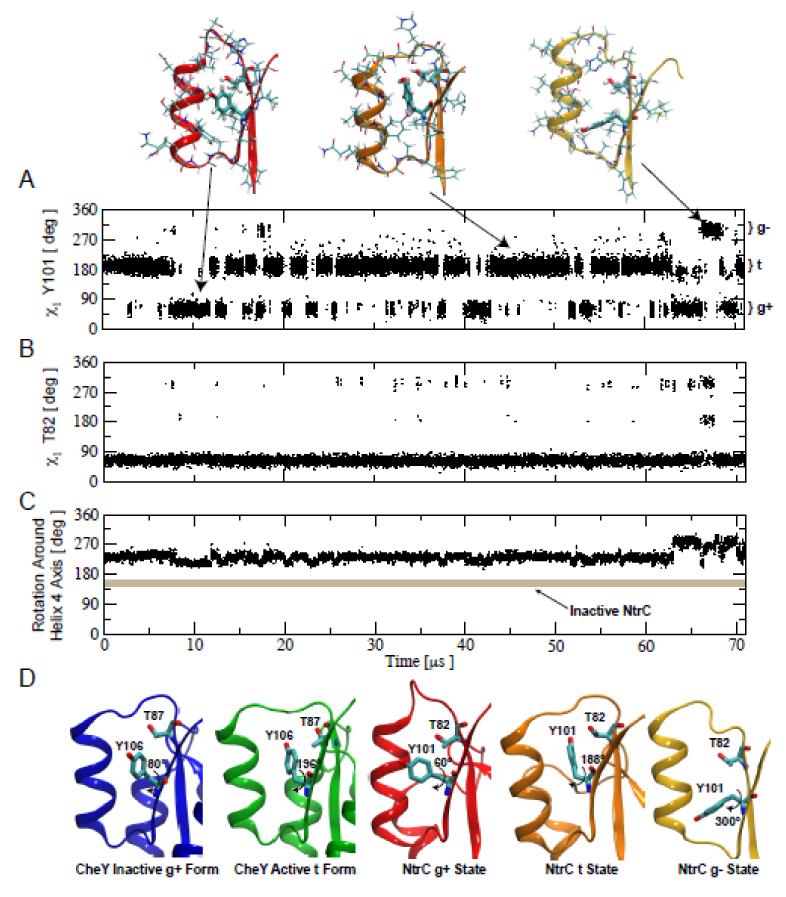
Figure 3. Within the active state several rotameric states are accessible to Y101.
A) Time series of the χ1 angle of Y101 measured along a 71 μs long molecular dynamics simulation of the nonphosphorylated receiver domain of NtrCR in the active conformation. The region of helix α4–strand β4 is shown above for representative structures of the three Y101 rotameric regions sampled. B) Time series of the χ1 angle of T82 measured along the same MD simulation. C) Time series of a pseudo dihedral angle reporting on the rotation of the α4–strand β4 around its axis. As a reference, the value of the same order parameter for the inactive conformation of NtrCR is shown as a thick grey line demonstrating that NtrCR does not visit the inactive conformation during the 71 μs MD simulation. D) Comparison between the models for the inactive and active structures of CheY with the different χ1 angles of Y106 and the corresponding T87 orientation (pdbID 1FFG and 1FQW shown in blue and green, respectively) and the structures for the three rotameric states of Y101 with the corresponding T87 orientations visited during the simulation of the active conformation of NtrCR.

