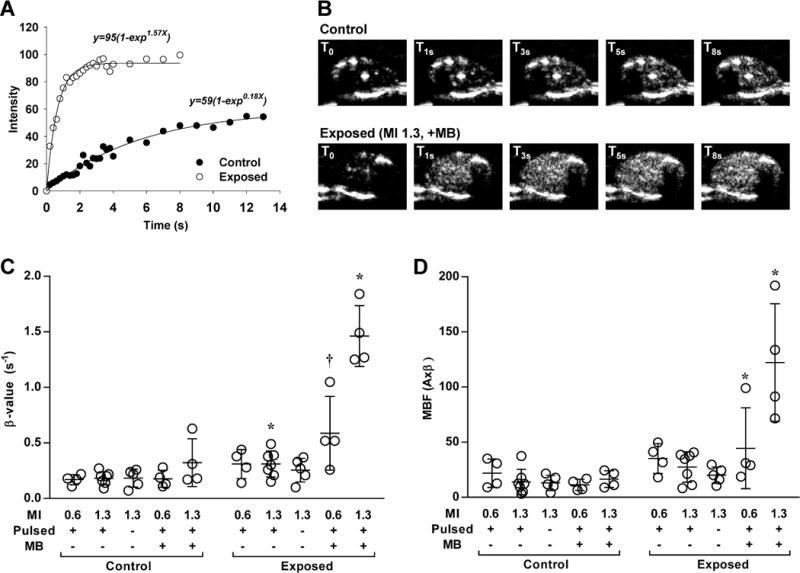
Figure 2.

Contrast ultrasound perfusion data from ultrasound-exposed and control contralateral hindlimbs using 2×10⁸ microbubble dosing. (A) Examples of time-intensity curves from the adductor muscle group obtained after a destructive pulse sequence in a leg after exposure to ultrasound (MI 1.3) in the presence of MBs and in the contralateral control leg. (B) Contrast ultrasound frames obtained from select intervals from the curves in panel A (T0=immediate post-destruction). (C and D) Dot plots with lines representing mean (±SD) of skeletal muscle microvascular blood flux rate (β) and microvascular blood flow (MBF) after each of the experimental conditions for the ultrasound exposed and contralateral control limb. MB, microbubble; MI, mechanical index. *p<0.05 versus contralateral control limb; †p=0.05 versus contralateral control limb; all tests were made by non-parametric analysis.
