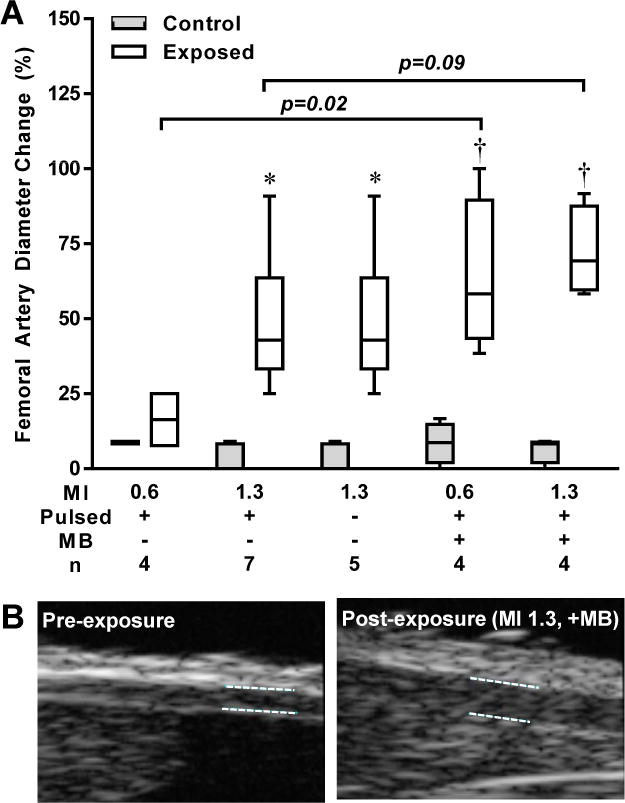
Figure 3.

Femoral artery dilation with ultrasound. (A) Box-whisker plots showing median (horizontal line), intequartile range (box), and 5–95th percentile (whiskers) for the percent change in femoral artery diameter measured after each of the experimental conditions for the ultrasound exposed and contralateral control limb. (B) Example of a femoral artery at baseline and after exposure to ultrasound (MI 1.3) and MBs. *p<0.05 versus contralateral control limb by paired analysis; †p<0.05 vs. baseline; all tests were made by non-parametric analysis.
