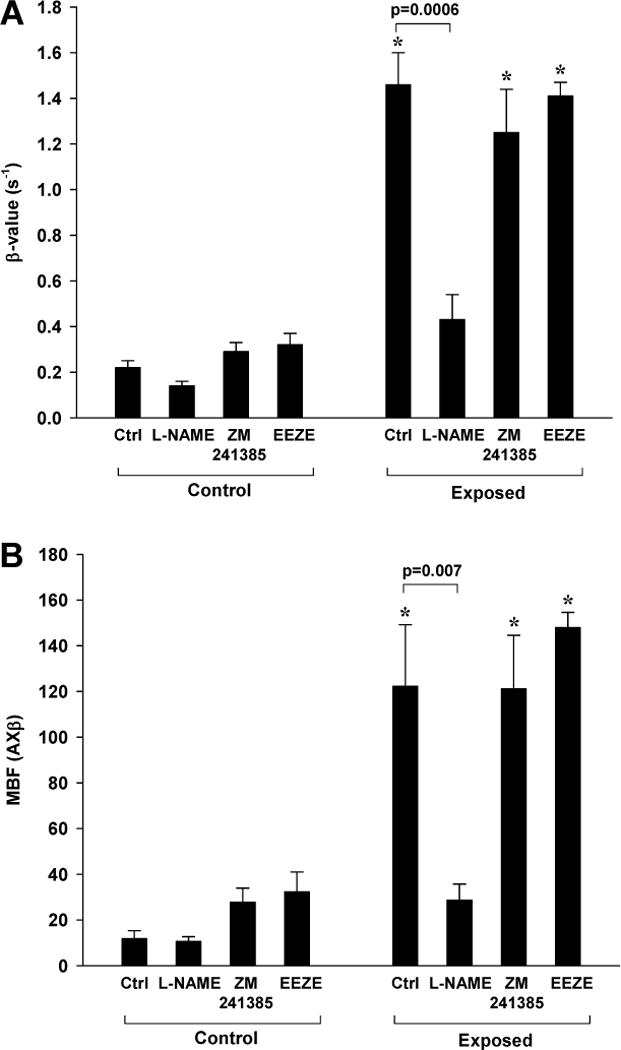
Figure 5.

Contrast ultrasound perfusion data in the presence of inhibitors to vasoactive compounds (n=5 for each condition). Data were obtained after 10 min exposure to intermittent ultrasound (MI 1.3) with MBs alone or after inhibition of NOS (L-NAME), adenosine-A2a receptor signal (ZM241385), or EET signaling (EEZE). Mean (±SEM) data control and ultrasound exposed leg are shown for (A) microvascular blood flux rate (β) and (B) microvascular blood flow (MBF). *p<0.01 versus contralateral control leg.
