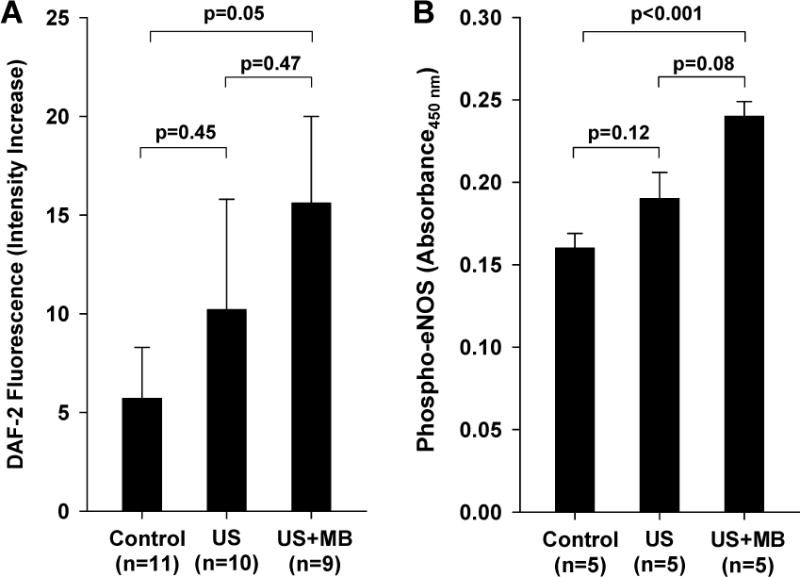
Figure 6.

(A) Time dependent increases in fluorescent intensity from the NO indicator DAF-2 from cultured endothelial cells exposed to ultrasound with and without microbubbles (MBs), and from non-exposed time-controlled cells. (B) Phosphorylated eNOS by ELISA from control muscle and muscle tissue within the imaging sector in muscle exposed to ultrasound with and without MB injection.
