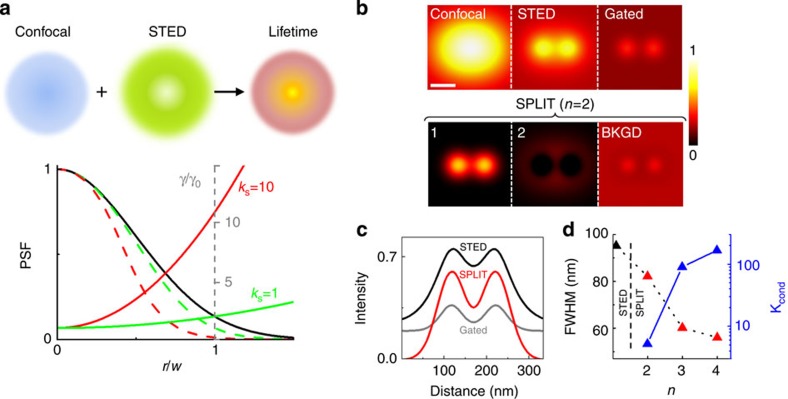
Figure 2. The SPLIT method in time-resolved CW-STED.
(a) A doughnut-shaped STED beam overlapped with a confocal spot generates a continuous distribution of dynamics within the DL-PSF. The STED beam intensity determines the relative variation of decay rate γ/γ0 (solid green (kS=1) and red (kS=10) line) within a Gaussian DL-PSF (solid black line) or the corresponding E-PSF (dashed green (kS=1) and red (kS=10) line). (b,c) Simulated average time-resolved confocal and STED images of two point-like particles plus a uniform level of uncorrelated background (confocal FWHM=200 nm, particles distance=104 nm, kS=10, τ0=2.5 ns, S=105, B=104) and horizontal profile. In the time-gated STED image (Tg=τ0) the signal becomes very low compared with the background level. In the SPLIT series, the photons of the super-resolved component 1 are efficiently separated from component 2 and from the background. The colourmap represents the simulated intensity normalized to the maximum value of the confocal image. Scale bar, 100 nm. (d) Resolution and noise propagation in the SPLIT method versus the number of components. Resolution and noise are quantified, respectively, as the FWHM of the SPLIT E-PSF and the condition number kcond obtained for kS=10 (FWHM of the STED E-PSF is shown for comparison as the first point).

