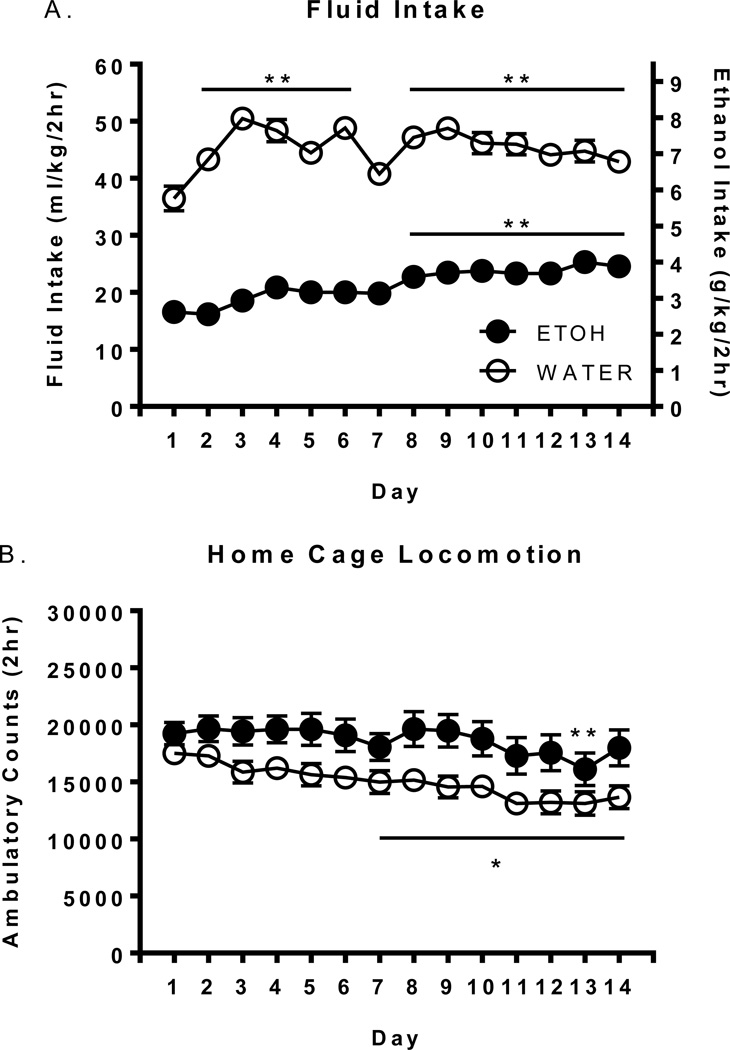
Figure 1.
Total fluid intake and home cage locomotor activity on days 1–14. Mean daily fluid intake (A) and home cage locomotor activity (B) in ethanol and water consuming HAP mice over 14 consecutive DID sessions. The left y-axis refers to both ethanol and water groups, whereas the right y-axis refers to ethanol animals only. *’s indicate significant within-fluid-group differences vs day 1 (** p<.01, * p<.05).

