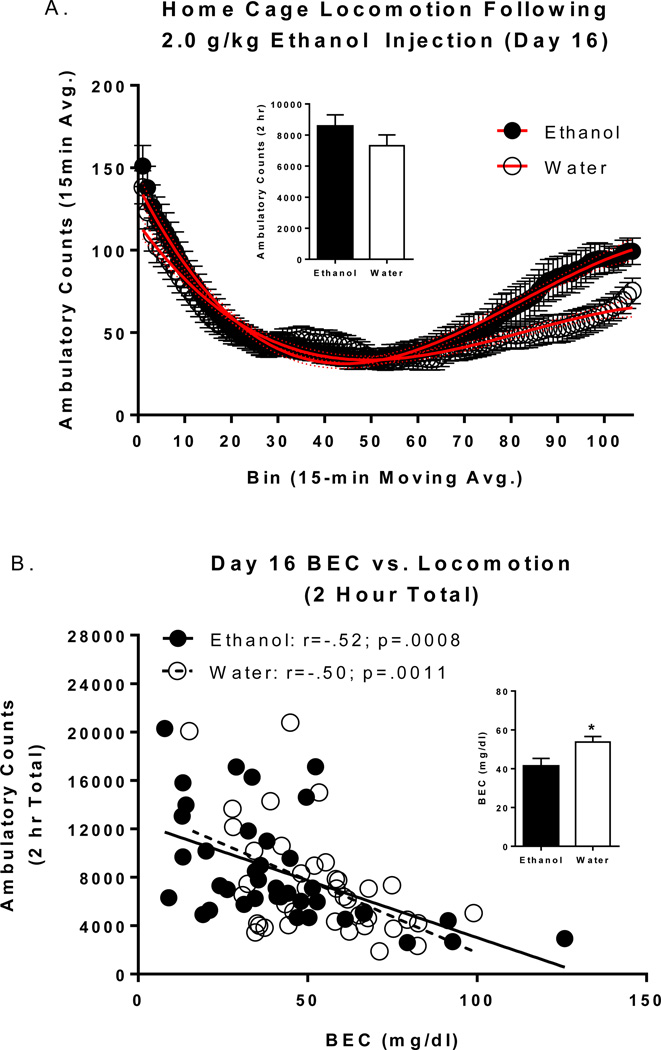
Figure 5.
BECs and home cage locomotion following ethanol injections (2.0 g/kg) on day 16. (A) Time course of home cage locomotion immediately following ethanol injections in groups assigned to ethanol and water on days 1–14. Inset reflects mean 2hour home cage locomotion. (B) The relationship between BEC and 2 hour home cage locomotion. Inset reflects mean BECs. * indicates between group differences (p<.05).

