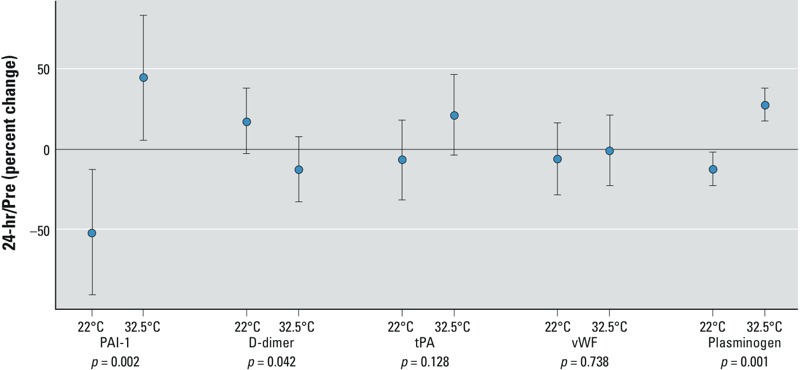
Figure 1.

Markers of coagulation after 2 hr ozone exposure at 0.3 ppm, with effects for moderate (22°C) and high (32.5°C) temperatures; the effect of ozone on coagulation markers on the late time point is shown. The point estimate of the mean (effect size) and 95% CIs for 16 subjects are shown. p-Values are for ozone–temperature interaction.
