
Figure 4.
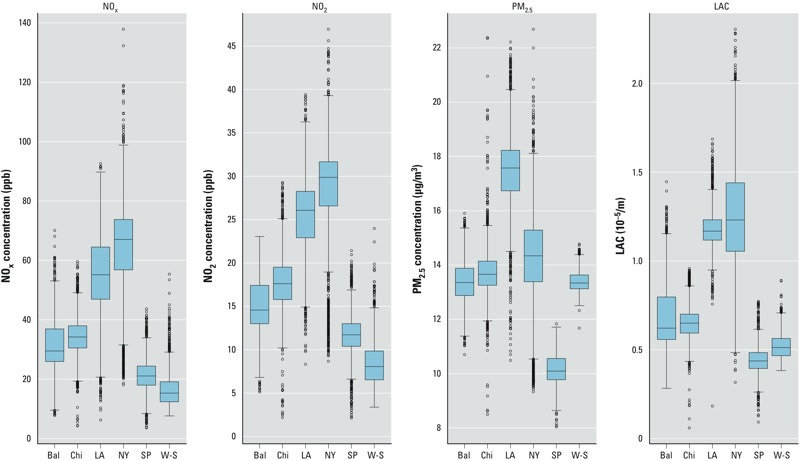
Pollutant- and region-specific box plots of long-term averages of predictions from 1999 through early 2012 at participant residence locations. Metropolitan region abbreviations: Bal, Baltimore; Chi, Chicago; LA, Los Angeles; NY, New York; SP, St. Paul; W-S, Winston-Salem. Boxes extend from the 25th to the 75th percentile, horizontal bars represent the median, whiskers extend 1.5 times the length of the interquartile range above and below the 75th and 25th percentiles, respectively, and outliers are presented as points.