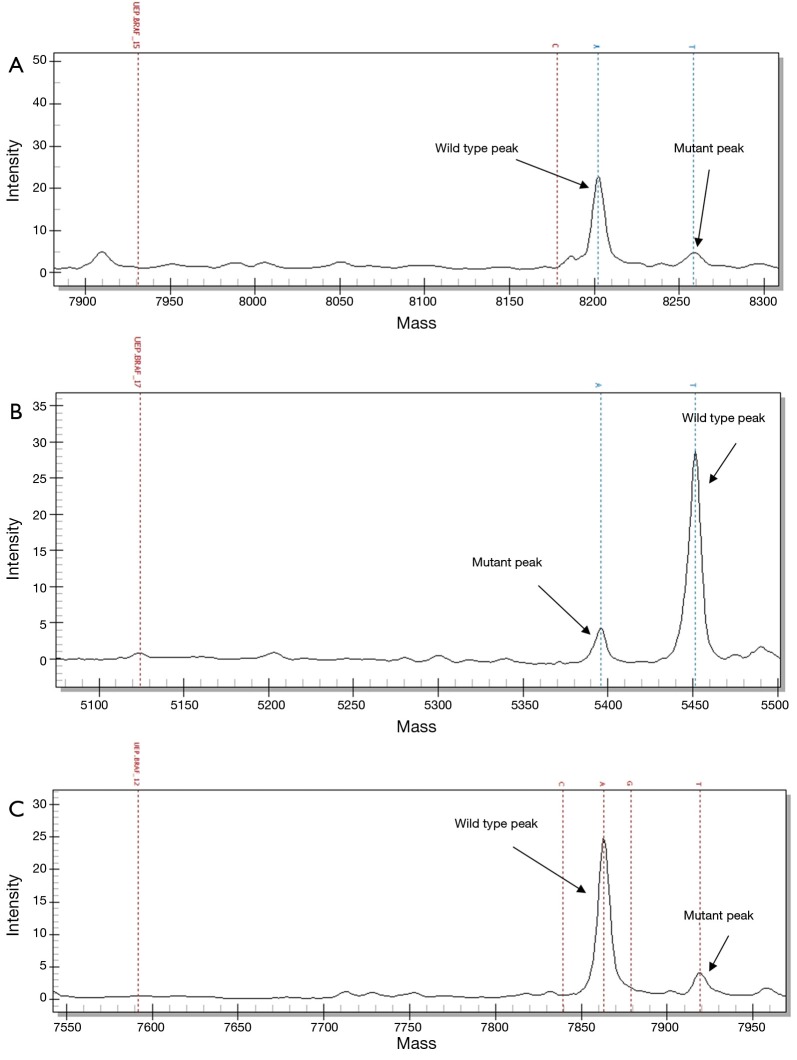
Figure 2.
Mass spectrometry of PCR products showing BRAF mutations (all three profiles showing the changes at the antisense strand of DNA). (A) BRAF V600E mutation (patient 1) with a mutant adenine (A) peak substituting for thymine (T) at position 1799 (c.1799T>A); (B) BRAF K601N mutation (patient 4) with a mutant T peak substituting for A (c.1803A>T); (C) BRAF L597Q mutation (patient 6) with a mutant A peak substituting for T (c.1790T>A).

