
Figure 2.
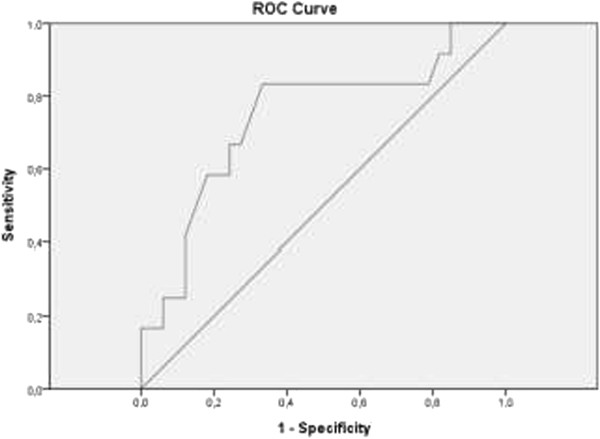
Receiver operating characteristic (ROC) curve analysis of the caval index as predictor of fluid responsiveness. Area under the curve 0.741. Optimal threshold value is 36.5% with 83% sensitivity and 67% specificity.
Official websites use .gov
A
.gov website belongs to an official
government organization in the United States.
Secure .gov websites use HTTPS
A lock (
) or https:// means you've safely
connected to the .gov website. Share sensitive
information only on official, secure websites.
Receiver operating characteristic (ROC) curve analysis of the caval index as predictor of fluid responsiveness. Area under the curve 0.741. Optimal threshold value is 36.5% with 83% sensitivity and 67% specificity.