
Figure 6.
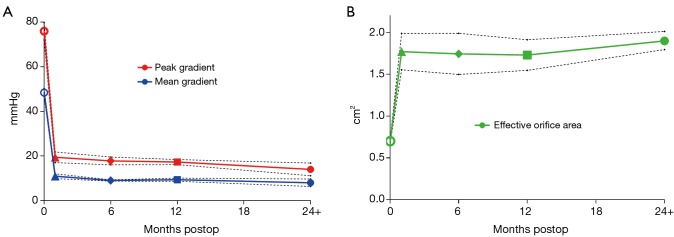
Hemodynamic outcomes of SU-AVR at up to 12-month follow-up. (A) Change in mean gradient and peak gradient after SU-AVR; (B) change in effective orifice area after SU-AVR. The solid line indicates the pooled results of the meta-analysis while the dashed lines represent 95% CI. Open circle, preoperative; closed triangle, discharge; closed diamond, 6-month follow-up; closed square, 12-month follow-up; closed circle, 2-year follow-up. SU-AVR, sutureless AVR; CI, confidence interval.