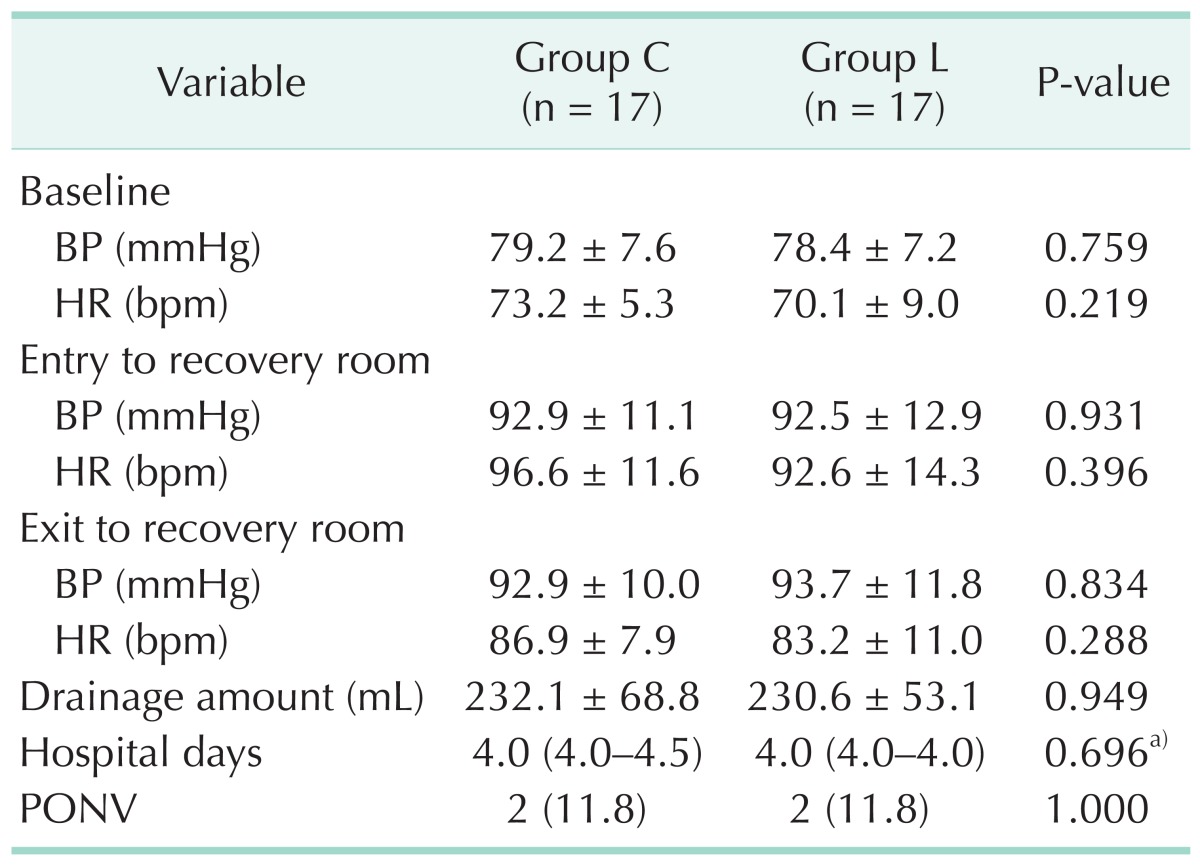
Table 3. Operative outcomes.

Value are presented as mean ± standard deviation, median (P25-P75) or number (%).
Group C, saline infiltration group; group L, 0.1% ropivacaine infiltration group; BP, blood pressure; HR, heart rate; POVN, postoperative nausea and vomiting.
a)Mann-Whitney U test was used and expressed as median (P25-P75) because of abnormal distribution.
