
Figure 2.
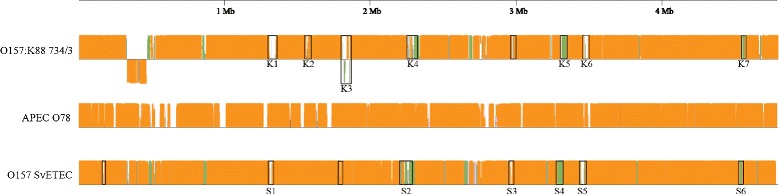
Comparative progressiveMauve analysis between the core scaffolds of each whole genome sequence and a reference genome, the closely related E. coli APEC O78. Predicted sequence homology among all three genome sequences is represented by orange regions. Green regions indicate sequence shared between the O157 core scaffolds only. Regions within black boxes are identified phage sequences and phage-associated regions. Sequence below the line of O157:K88 734/3 represents a predicted inversion, based on scaffold tiling to the APEC O78 reference.