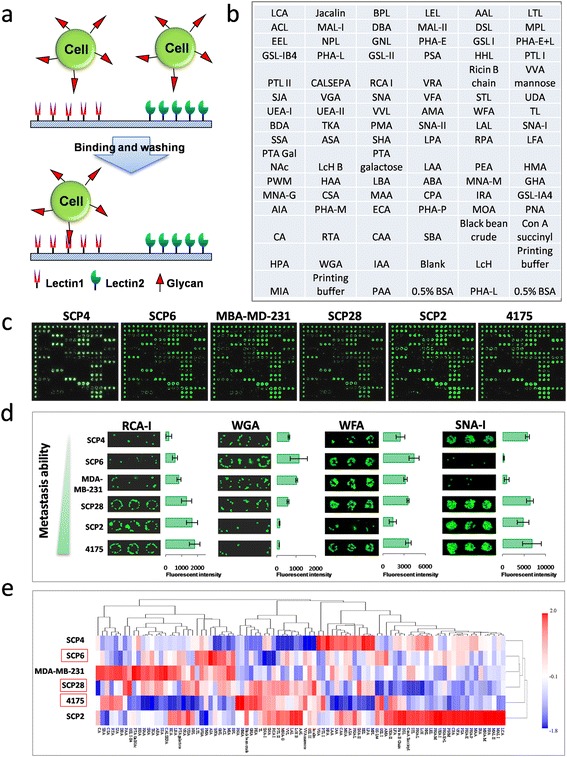
Figure 1.

Identification of metastasis-specific lectin binding to TNBC cells. (a) Schematic of the probing of fluorescently labeled cells on the lectin microarray. (b) Layout of the lectin microarray containing 91 lectins. (c) Representative lectin microarray binding patterns of the six TNBC cell lines. (d) Four lectins exhibited different extents of binding to the six different TNBC cell lines. The indicated intensities are represented as the mean values ± standard deviation (SD), n = 4. (e) Clustered heat map of the lectin cell-binding profiles. This map was generated and clustered according to the lectin-binding pattern and mean intensity. The order of the cells in this map closely matches their order of metastatic capacity. TNBC, triple-negative breast cancer.
