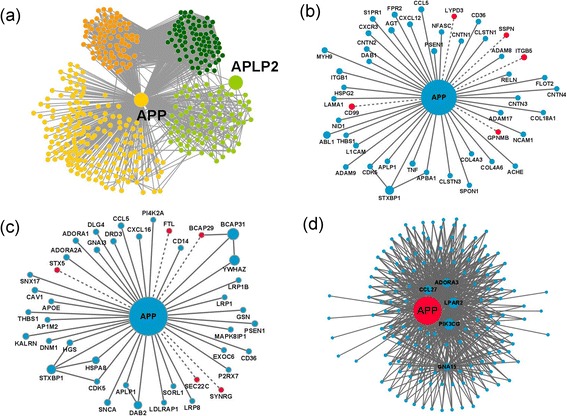
Figure 3.

APP protein-protein interaction networks. (a) Local APP/APLP2 network. Proteins with light orange (M1) and dark orange (M4) are mostly involved in G-protein coupled receptor protein signaling pathway (Biological Process; BP) and located at the plasma membrane (Cellular Component; CC). Proteins with light green (M2) and dark green (M3) are mostly involved in regulation of apoptosis (BP) and located at the cell surface (CC). (b) Subnetwork of APP interactors involved in cell adhesion (BP) extracted from the extended APP/APLP2 protein-protein interaction network. (c) Subnetwork of APP interactors involved in vesicle-mediated transport (BP) extracted from the extended network. Red colored nodes represent the proteins from the YTH screen. Blue colored nodes indicate interactors extracted from the DBs. Node size represents relative degree of the nodes and the other interactions of nodes are neglected for the sake of simplicity. Dashed lines represent the interactions revealed by the YTH screening in human testis and solid lines are interactions from DBs. (d) Subnetwork of APP interactors involved in G-protein-coupled singnal pathways.
