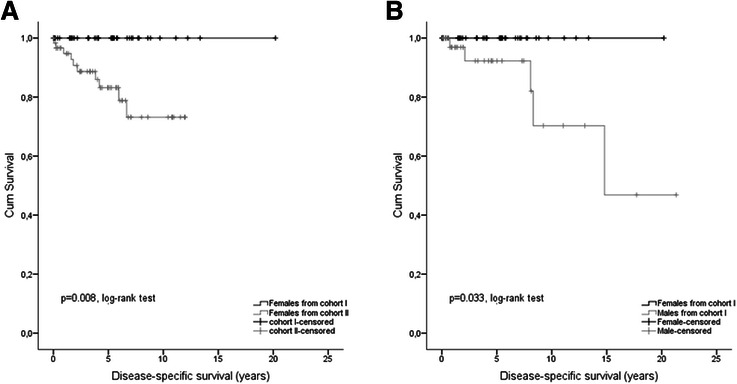
Figure 3.

Age and gender related outcome regarding DSS. (A) Kaplan–Meier curves of disease-specific survival (DSS) for female GIST patients of study cohort I (<50 years at diagnosis) versus study cohort II (≥50 years at diagnosis). (B) Kaplan–Meier curves of disease-specific survival (DSS) for gender-related differences of GIST patients younger than 50 years at diagnosis (study cohort I).
