Figure 1.

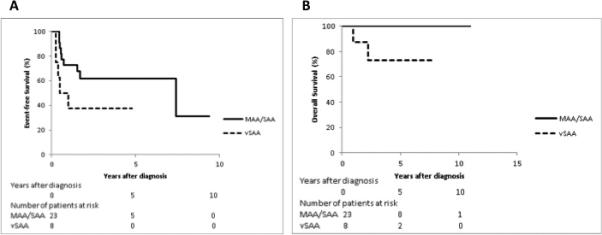
Figure 1A. EFS of AA patients who received IST and were diagnosed ≥2000, by disease subgroup (MAA/SAA, n=23; vSAA, n=8; p=0.08)
Figure 1B. OS of AA patients who received IST and were diagnosed ≥2000, by disease subgroup (MAA/SAA, n=23; vSAA, n=8; p=0.02)
