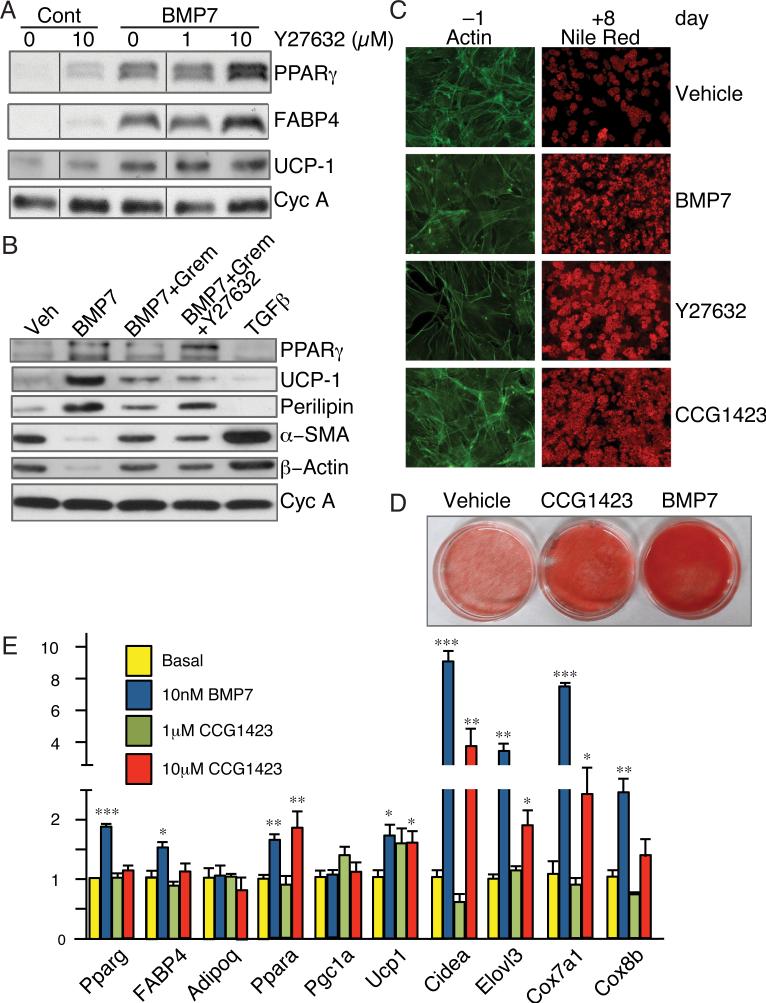
Figure 2. Inhibition of ROCK or SRF activity promotes commitment to the adipogenic lineage.
(A) C3H/10T1/2 cells were treated with the indicated concentrations of Y27632 in the presence or absence of BMP7 and induced to differentiate for 8 days and extracted proteins analyzed by Western blot.
(B) C3H/10T1/2 cells were treated with Gremlin1 and/or Y27632 2 h prior to the addition of BMP7 or TGFβ, as indicated. Following adipocyte differentiation (day 8), total cellular proteins were analyzed.
(C) C3H10T1/2 cells were exposed to either BMP7, Y27632 or CCG1423 (10 μM) and actin filaments were analyzed after 2 days as in Figure 1G (left panels) or allowed to mature to adipocytes and stained with Nile Red (right panels).
(D) Subconfluent C3H10T1/2 cells were treated with either CCG1423 or BMP7 for 3 d prior to induction of differentiation for 8 d, at which stage cultures were visualized following Nile Red staining.
(E) C3H/10T1/2 cells were treated with 1 μM or 10 μM CCG1423, or BMP7 for 3 d and induced to differentiate. Total RNA was subjected to q-PCR analysis. Non-adjacent lanes on Western blots in panel A are indicated by a vertical line. See also Figure S2.

