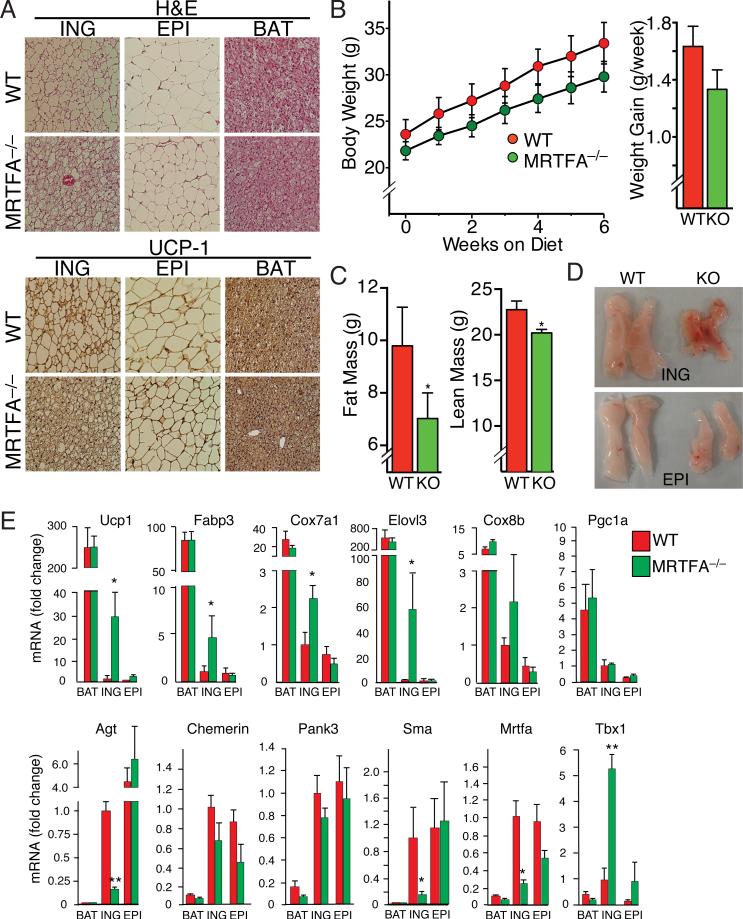
Figure 4. MRTFA deficiency in mice enhances recruitment of beige adipocytes to the white adipose depots.
(A) H&E and UCP1 staining of representative sections (n=7) of ING (Inguinal) WAT, EPI (Epididymal) WAT and BAT from 11-13 wk-old WT and MRTFA–/– (KO) mice on rodent diet with 10% kcal% fat.
(B) Body weight and average weight gain per wk of WT and MRTFA–/– mice on rodent diet with 10% kcal% fat (n=5/group, *p<0.05).
(C) Body composition determined by NMR (described in Experimental Procedures) analysis of mice from (B) (Data presented mean ± SEM, n=5/group, *p<0.05).
(D) Gross morphology of representative ING and EPI fat pads of mice from (B).
(E) Relative mRNA levels of BAT and WAT enriched genes as well as other genes in WAT and BAT depots of 15 wk old WT and MRTFA–/– mice on chow diet was analyzed by qPCR (Data presented mean ± SEM, n=4/group, *p<0.05, **p<0.01). See also Figure S4.

