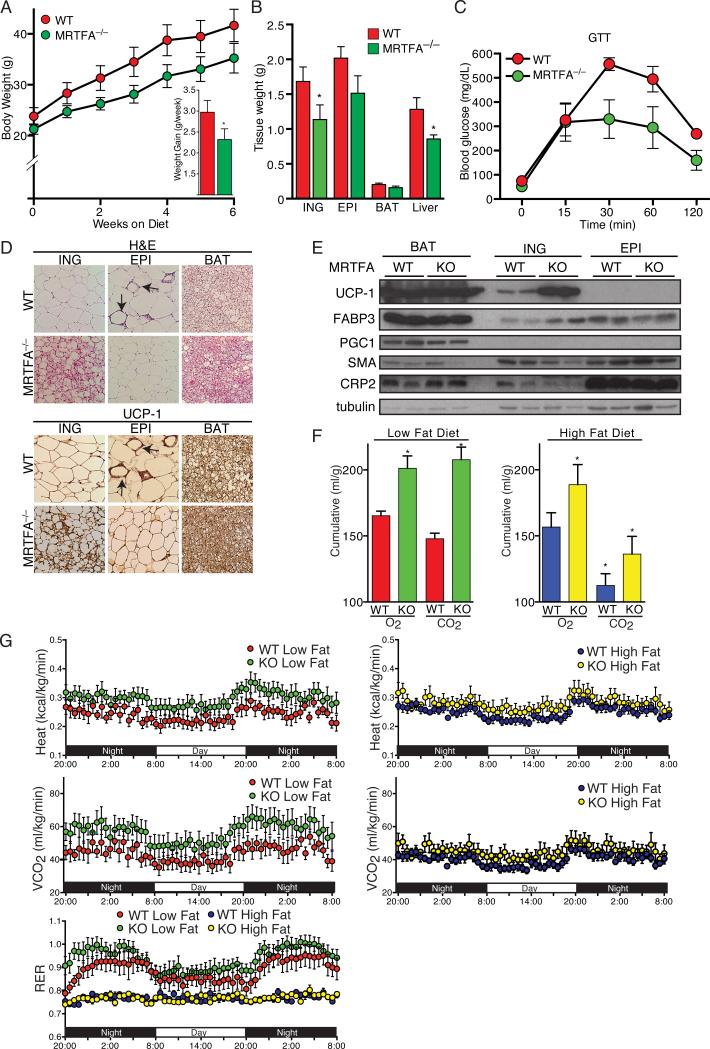
Figure 7. MRTFA-deficient mice are protected from diet-induced obesity and its associated insulin resistance and exhibit altered whole body energy expenditure.
(A-B) WT and MRTFA–/– mice, starting from 4-5 wk old, were fed a rodent HFD (60% kcal% fat) for 6 wk. Body weight and weight gain were measured in weekly intervals (A), while weights of ING WAT, EPI WAT, BAT and liver were measured at end of study (B).
(C) After 5 wk on the HFD, mice were then IP injected with glucose at 2 mg/kg of body weight after fasting overnight and whole blood glucose was measured at 15, 30, 60 and 120 min.
(D) H&E and UCP1 staining of sections of ING, EPI and BAT depots.
(E) Western blot analysis of BAT and WAT enriched genes as well as other genes in WAT and BAT depots of WT and MRTFA–/– mice were conducted as in Figure 4. Arrows point to crown-like structures. Data presented are mean ± SEM, n=6-7/group *p<0.05, **p<0.01.
(F-G) WT and MRTFA–/– mice on LFD or HFD for 6 wk were housed individually in metabolic chambers for 3 days and 2 nights. Cumulative O2 consumption and CO2 production were measured by CLAMs (F) Traces of heat production, CO2 production and RER during 12 h dark and light cycles (G) RER (respiratory exchange ratio) were calculated by volume of carbon dioxide produced (exhaled)/volume of oxygen consumed (inhaled). Data presented are mean ± SEM, n=5-7/group, *p<0.05. See also Figures S5 and S6.

