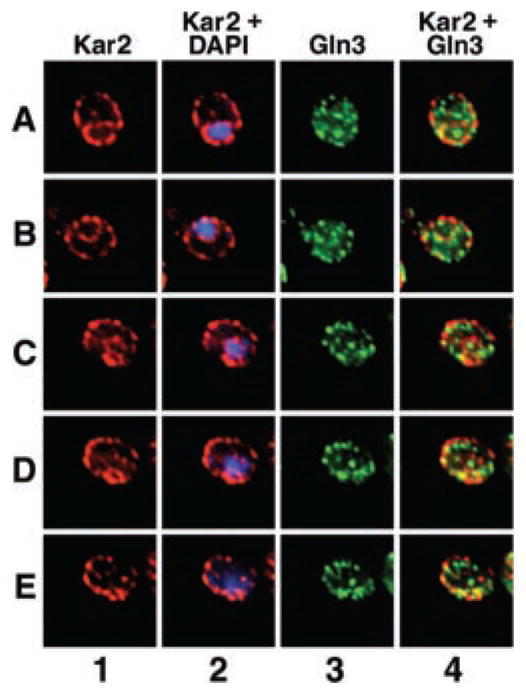
Fig. 10. Intracellular localization of Gln3 and Kar2 in cells provided with glutamine as sole nitrogen source.
Cultures (TB123) were grown to mid-log in YNB-glutamine medium and processed for indirect immunofluorescence. Localization of Gln3-Myc13, Kar2, and the nuclei were determined by staining with monoclonal antibody 9E10 anti-Myc (columns 3 and 4, green), rabbit polyclonal antibody anti-Kar2 (columns 1, 2, and 4, red), and DAPI (column 2, blue), respectively. Merged images (columns 2 and 4) show the overlap of Kar2 and DAPI-stained material and Gln3 and Kar2 (yellow), respectively. Micrographs were imaged using a Zeiss Axioplan 2 imaging microscope. 0.4-μm sections were collected as a Z-stack, and one image from the center of that stack is shown in rows A and B. Images in rows C–E show three contiguous sections from a single Z-stack. Images were deconvolved with AxioVision 3.0 software using the constrained iterative algorithm.

