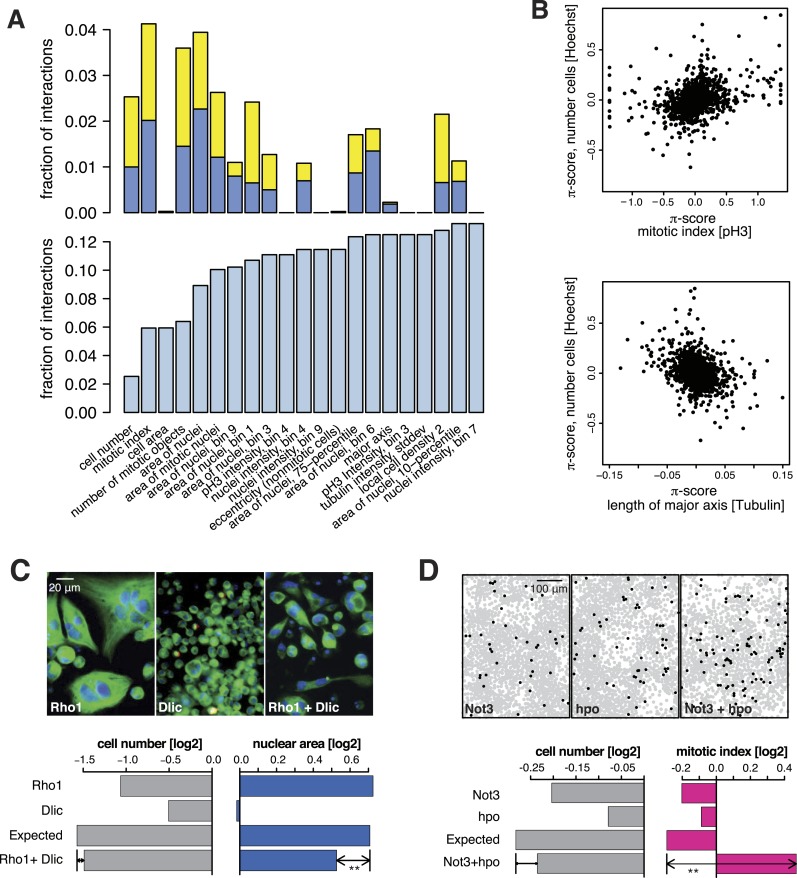
Figure 2. Genetic interactions across multiple phenotypes.
(A) On top, the fraction of genetic interactions over all gene pairs (at FDR 0.01) for each feature is shown. Blue: negative interactions, yellow: positive interactions. The lower panel shows the cumulative distribution of genetic interactions. The kth bar shows the fraction of gene pairs that show a genetic interaction in at least one of the first k features. (B) Genetic interactions for different phenotypes were non-redundant. Plots compare genetic interactions affecting cell number, mitotic index and length of major cell axis. (C and D) Many genetic interactions were phenotype-specific. Interactions at a FDR of 0.01 for a moderated t-test (See ‘Materials and methods’) are marked by (**). Images in (C) show cells after RNAi of Rho1 (left), Dlic (center) and both together (right). Bar charts show single-gene effects, effects expected without a genetic interaction, and effects observed by the double-RNAi. Images in (D) show cell centres identified by image analysis after RNAi of Not3 (left), hpo (center) and both (right). Black and grey colours indicate whether a cell was pH3-positive or negative (mitotic state).

