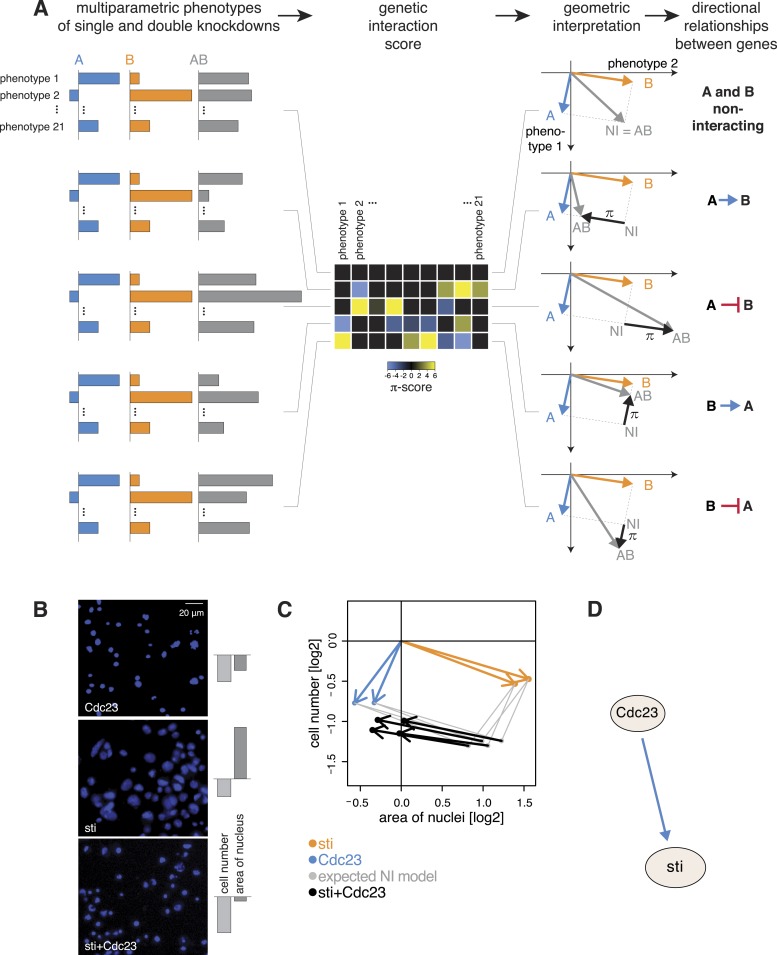
Figure 4. Deriving directional genetic interactions.
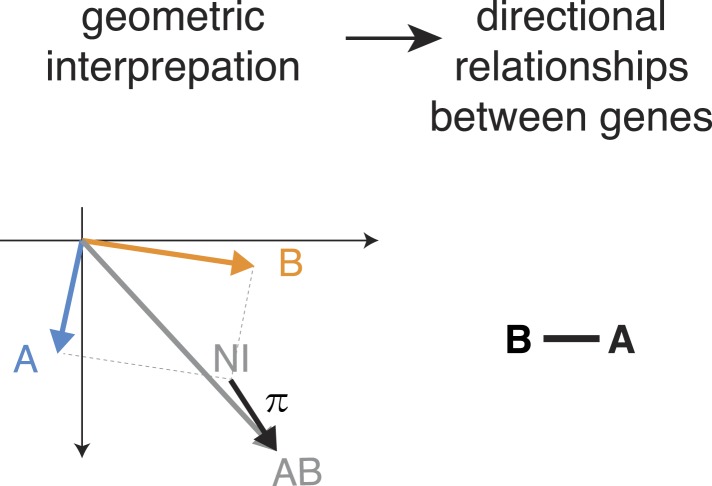
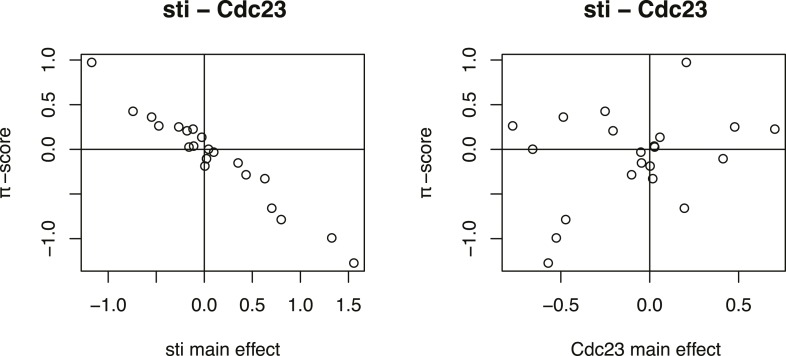
(A) Multiparametric phenotypes are extracted for single and double knockdowns. Genetic interaction scores are computed for each double knockdown experiment. The schematic plots in the third column show the model for identifying directional genetic interactions between gene A and gene B using two exemplary phenotypes. The single knockdown phenotypes of genes A and B and the measured double knockdown phenotypes (AB) are depicted as arrows. The expected double knockdown phenotype for non-interacting (NI) genes, which is the sum of the single gene effects, is depicted by the symbol NI. Black arrows depict the genetic interaction π. The first row shows the case where genes A and B are not interacting. Below, four types of interaction between the genes A and B are shown: gene A is alleviating to gene B, gene A is aggravating to gene B; and in reverse, B alleviates or aggravates gene A. Whenever the genetic interaction (black arrows) is parallel or anti- parallel to one of the single gene effects, a directional genetic interaction is called. (B–D) A directional interaction detected between Cdc23 and sti. (C) The two orange and two blue arrows show the phenotypes (nuclei area and cell number) of the two dsRNAs designed for sti and Cdc23. The grey dots show the expected double knockdown effect for the two genes. The black arrows, indicating the genetic interaction, are directed opposite to the phenotype of sti, indicating that functional Cdc23 is required for the phenotype of sti. (D) Graphical annotation of the detected alleviating epistasis from Cdc23 to sti as shown in (B–C).


