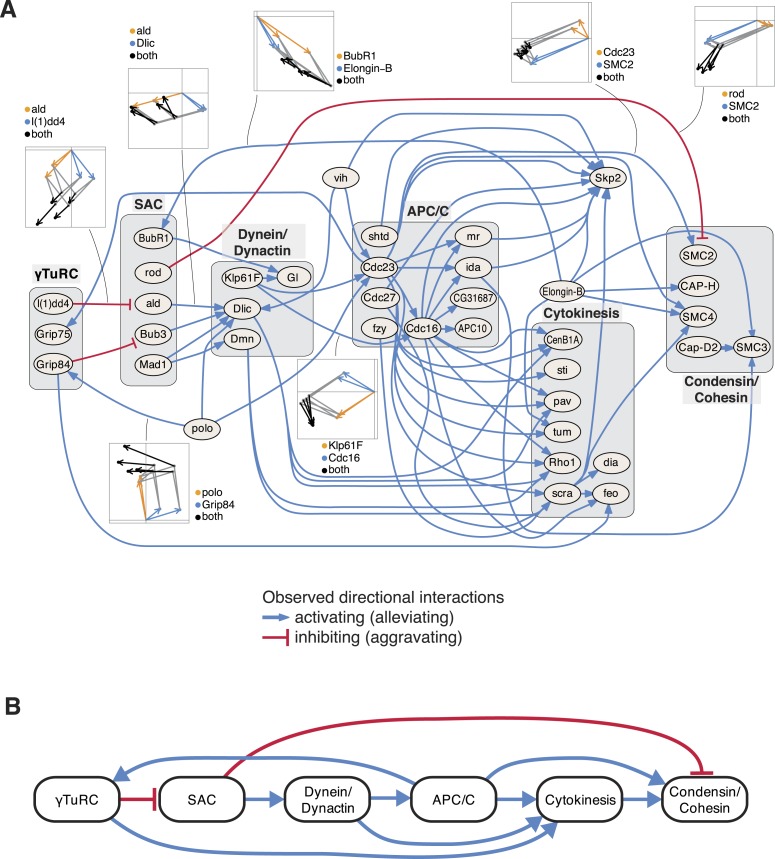
Figure 5. An epistatic network of mitotic genes.
(A) Graph showing data-derived epistatic interactions of genes that are key regulators of cell cycle events, including polo, and members of the γTuRC, SAC, APC/C, the dynein/dynactin complex, sister chromatid cohesion complexes and cytokinesis genes. Blue arrows show alleviating epistatic interactions and red arrows show aggravating epistatic interactions. Exemplarily, the underlying data is shown for epistatic interactions. (B) Epistatic network of complexes that regulate mitotic events, as derived from the epistatic interactions between the members of the complexes.

