. 2015 Apr 7;4:e06184. doi: 10.7554/eLife.06184

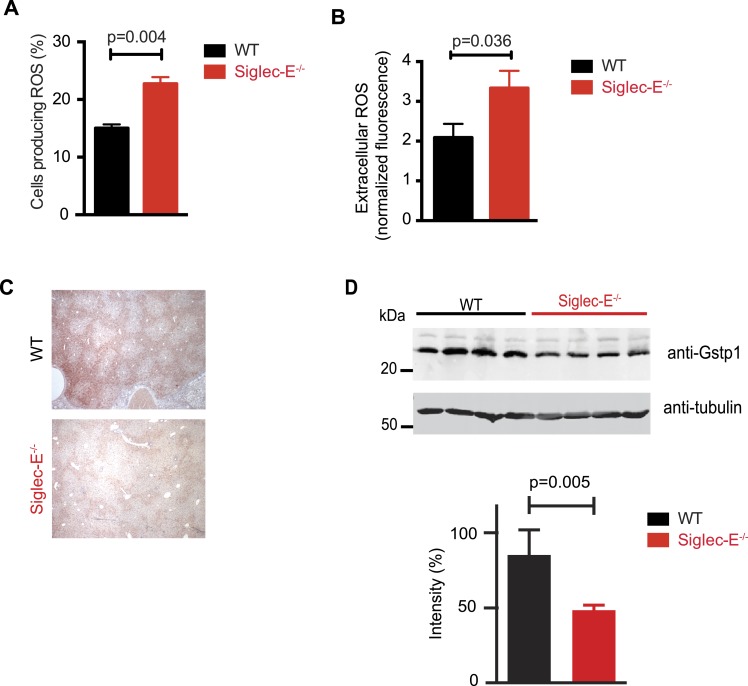
Figure 3. Altered ROS homeostasis in mice lacking Siglec-E.

(A) Neutrophils purified from bone marrow were incubated with immunocomplexes. Cells producing vacuolar ROS were measured by flow cytometry after 60 min. Representative of three experiments, for each n = 3. (B) Neutrophils secrete ROS upon stimulation with PMA for 60 min. Extracellular ROS were detected with a probe that does not cross the plasma membrane (n = 11–12). (C) Representative Gstp1 immunohistochemistry in liver from WT or Siglec-E−/− male mice at 100 weeks. Expression pattern is altered in the knockout mice. (D) Immunoblot analysis and quantification of Gstp1 expression in liver of 100-week-old mice. The level of Gstp1 protein is reduced of about 40%. p was calculated with a Student's t test, n = 4.

DOI: http://dx.doi.org/10.7554/eLife.06184.016

Figure 3.

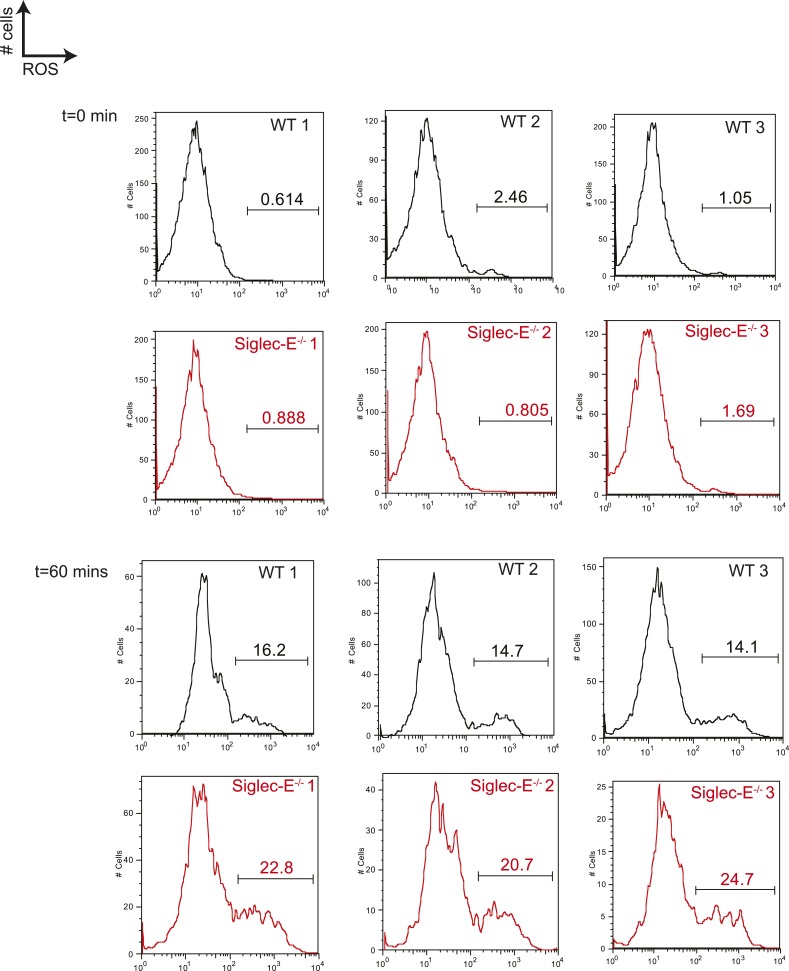
Figure 3—figure supplement 1. Neutrophils lacking Siglec-E are more prone to oxidative burst.

Figure 3—figure supplement 1.

Neutrophils isolated from bone marrow were incubated with immunocomplexes conjugated with a probe sensitive to ROS. Flow cytometry profiles at 60 min indicate that cells lacking Siglec-E are more prone to produce ROS, whereas the levels of ROS are comparably low before stimulation. Gates indicate cells producing ROS.
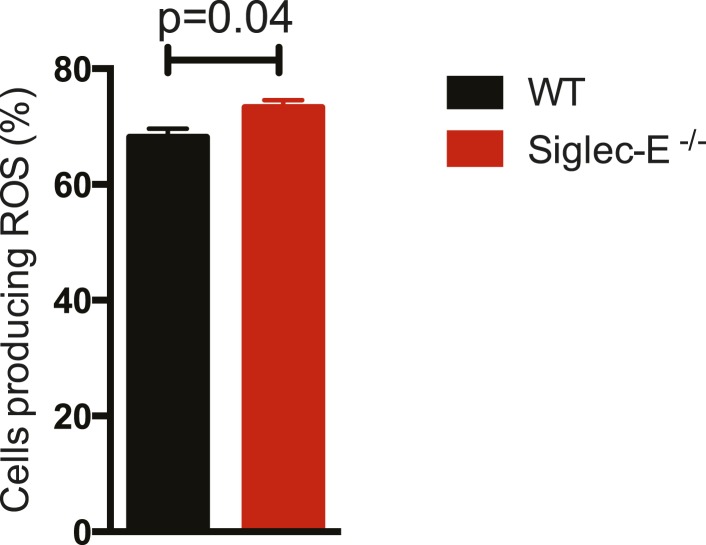
Figure 3—figure supplement 2. Thioglycollate-elicited neutrophils from Siglec-E−/− produce higher ROS than WT controls.

Figure 3—figure supplement 2.

Neutrophils isolated from peritoneum were incubated with immunocomplexes conjugated with a probe sensitive to ROS. The percentage of cells producing ROS after 60 min of incubation is higher when Siglec-E is absent, n = 3.
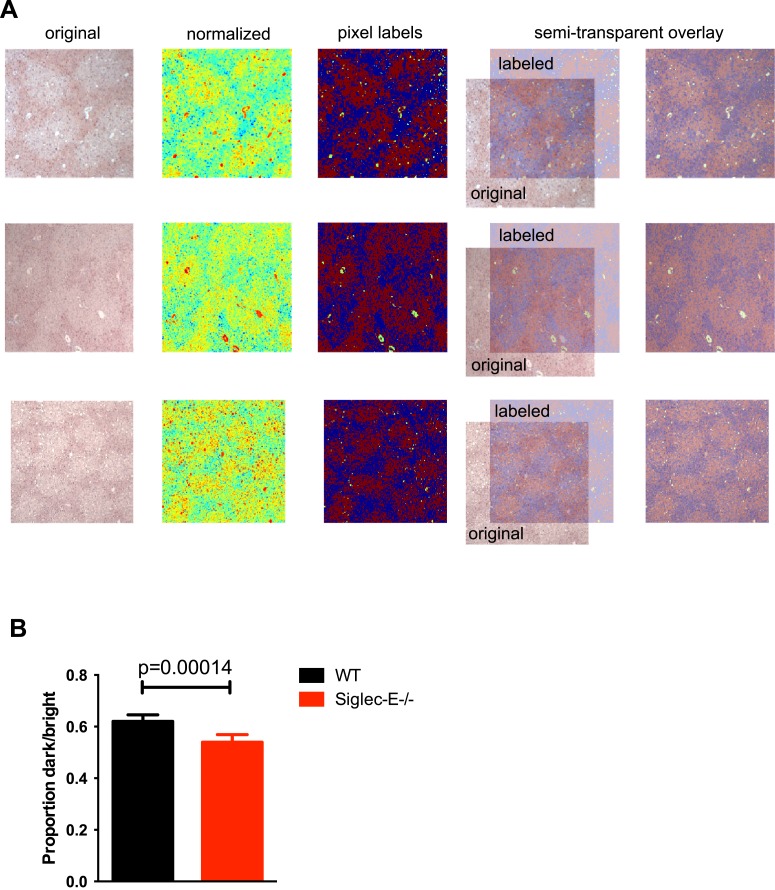
Figure 3—figure supplement 3. Gstp1 is found in lower levels in the liver of Siglec-E−/− mice.

Figure 3—figure supplement 3.

(A) Representative images generated during analysis of Gstp1 staining of liver tissues. Original images (left) were converted to grayscale to discard color information and only indicate brightness. Normalized images are shown in the second column (with jet color map). Images with pixel labels are in the third column (red: bright pixels, blue: dark pixels, green: discarded from analysis). In the last column, the labeled images are overlayed on the original image to compare pixel labels to the original (30% transparency). Three images per liver sample were acquired and processed in this way. (B) Quantification of the Gstp1 staining, as measured by the proportion of dark/bright areas. Mean ± sem, n = 8.