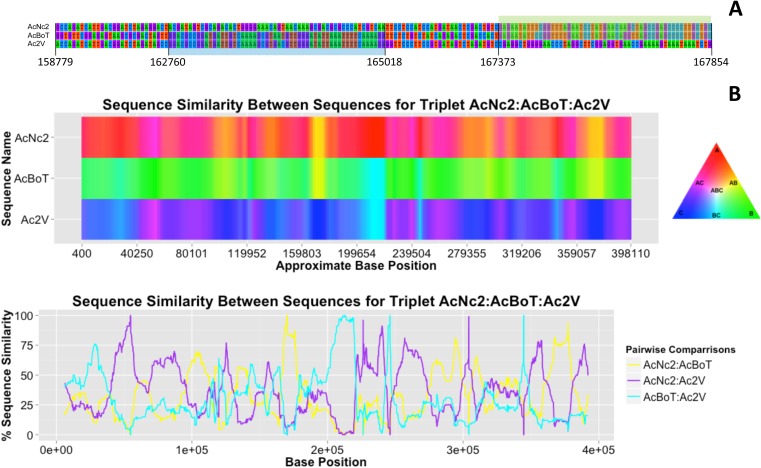
Figure 4. Variation in sequence similarity between races.
(A) Alignment of nucleotides in between positions 158,779 and 167,382 within ‘contig 1’ of three A. candida races (AcNc2, AcBoT and Ac2V) illustrating two recombination blocks coloured blue and green. Both blocks show high sequence similarity between races. Also shown is the sequence divergence in between blocks. Alignment gaps and monomorphic sites have been removed. (B) The sequence similarity at ‘contig 1’ amongst three A. candida races was visualised using the colours of a RBG colour triangular in the software HybRIDS (http://www.norwichresearchpark.com/HybRIDS). Areas where two contigs have the same colour (yellow, purple or turquoise) are indicative of two races sharing the same polymorphisms. The linear plot of the proportion of SNPs shared between the three pairwise comparisons between the races. Shown on the X-axis is the actual base position. The graphs were made in the R package HybRIDS (http://www.norwichresearchpark.com/HybRIDS).

