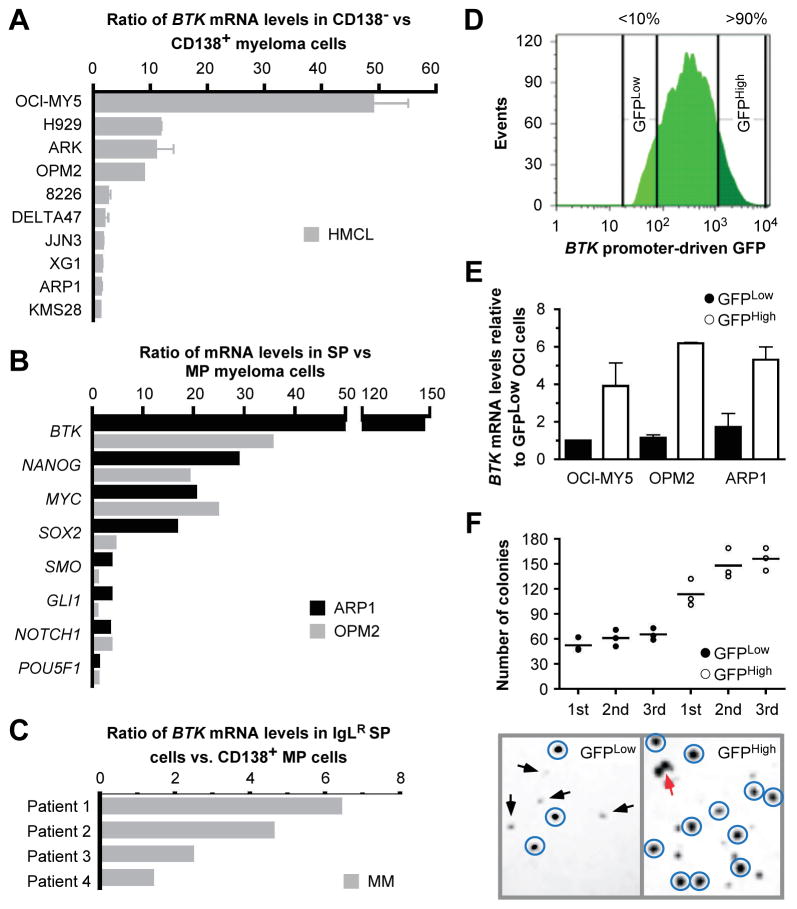
Figure 2. Upregulation of BTK is associated with features of stemness in myeloma.
(A) qPCR data indicating ratios of mean BTK mRNA levels (horizontal columns) and standard deviations of the mean (horizontal error bars) of flow-sorted CD138− and CD138+ myeloma cells. For each cell line (n = 10), the mean BTK expression level seen in CD138+ cells was set to 1 and then used as benchmark to calculate the fold-increase in CD138− cells.
(B) qPCR results indicating ratios of mean mRNA levels of CSC-associated genes (horizontal columns) in flow-sorted side population (SP) vs. main population (MP) myeloma cells.
(C) qPCR data indicating ratios of BTK mRNA levels in immunoglobulin light-chain (IgL)-restricted (IgLR) SP cells vs. CD138+ MP cells from 4 patients with myeloma.
(D) Flow histogram depicting the fluorescence intensity profile of ARP1 myeloma cells harboring a lentivirus-encoded green fluorescence protein (GFP) reporter gene driven by the human BTK core promoter. The top and bottom 10 percent of cells featuring high and low GFP expression, respectively, were flow sorted and designated GFPHigh and GFPLow, respectively.
(E) qPCR result indicating that GFPHigh cells contain elevated levels of BTK message compared to GFPLow cells.
(F) Colony growth data demonstrate that ARP1 GFPHigh cells have increased clonogenic potential relative to GFPLow cells. Cell clusters counted as colony are circled. Two independent colonies that begin to merge are indicated by light arrow. Small aggregates of cells not counted as colonies are indicated by dark arrows.

