
Figure 3. Enforced expression of BTK in myeloma cells confers features of stemness.
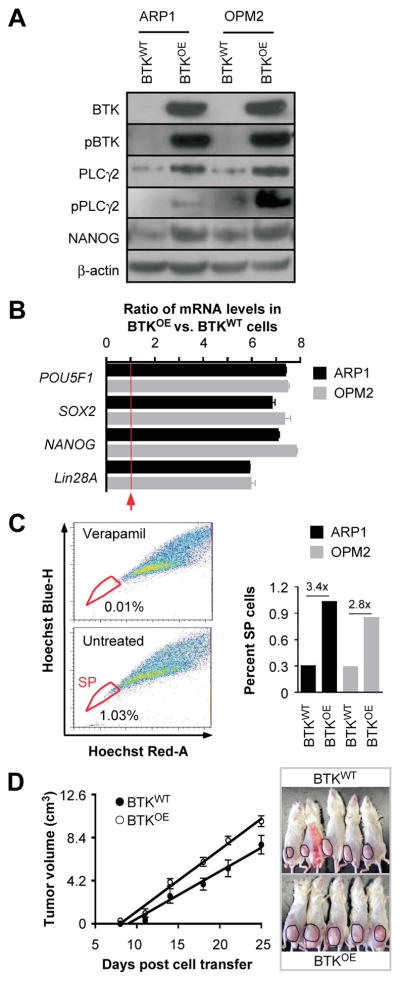
(A) Immunoblot analysis of BTKOE and BTKWT ARP1 and OPM2 myeloma cells.
(B) Bar diagram of qPCR measurements indicating elevated expression of 4 stemness genes in BTKOE compared to BTKWT cells.
(C) Shown to the left are the percentages of SP (indicated in circle) in ARP1-BTK overexpressing cells gated based on verapamil treated cells. The bar graph to the right depicts the fold increase in the SP fraction in BTKOE vs. BTKWT samples.
(D) Time course of tumor growth in NOD-SCID mice indicating that BTKOE cells are more aggressive than BTKWT cells.