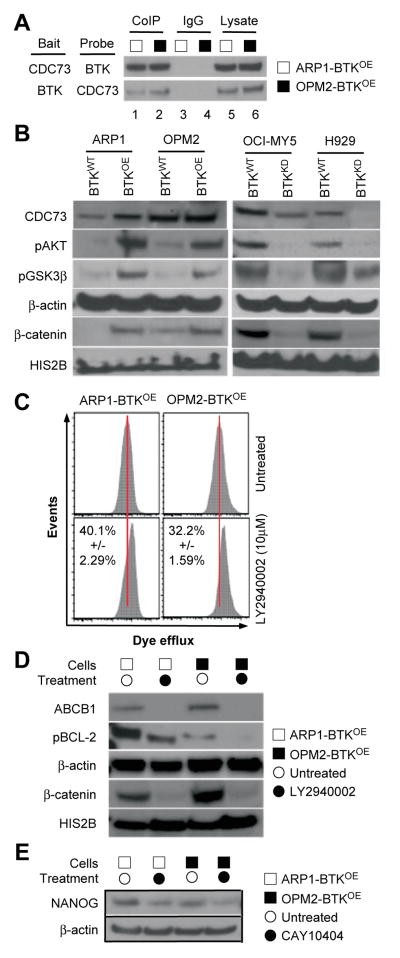
Figure 6. Interrogation of the BTK signaling pathway in myeloma.
(A) Western blot of a co-immunoprecipitation (Co-IP) experiment indicating physical interaction of BTK and CDC73 in BTK-overexpressing ARP1 and OPM2 cells (lanes 1–2). IgG isotype control (lanes 3–4) and whole cell lysates without Co-IP (lanes 5–6) were included for comparison.
(B) Immunoblots demonstrating reciprocal changes in AKT and WNT pathways in BTKOE and BTKKD cells, respectively, relative to their respective BTKWT controls.
(C) Flow cytometry histogram depicting eFluxx assay fluorescence intensity profiles of BTKOE ARP1 and OPM2 cells treated with the indicated AKT inhibitor (bottom panels) or left untreated (top panels).
(D) Immunoblots indicating AKT inhibitor-dependent reductions in ABCB1, pBCL-2 and β-CATENIN levels in BTKOE ARP1 and OPM2 cells. β-ACTIN and HIS2B were used as loading controls.
(E) Immunoblots indicating WNT inhibitor-dependent reductions in NANOG in BTKOE ARP1 and OPM2 cells.

