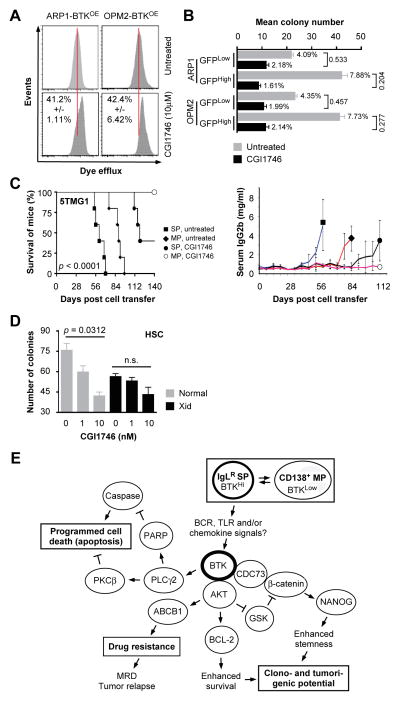
Figure 7. Preclinical testing of CGI1746.
(A) Flow histograms of eFluxx dye retention assays using BTKOE ARP1 and OPM2 cells treated with CGI1746.
(B) Bar diagram of colony formation results indicating CGI1746-dependent reductions in clonogenicity of GFPHighBTKHigh vs. GFPLowBTKLow myeloma cells.
(C) Kaplan-Meier survival curve (left) of C57BL/KaLwRij mice treated with IV injections of either SP or non-SP 5TGM1 cells, followed by treatment of mice with CGI1746 or solvent control and the right panel is a graph of mean serum IgG2b levels of tumor-bearing mice.
(D) Column diagram presenting results of colony formation assays of hematopoietic stem cells (HSC) obtained from BTK-deficient Xid or normal mice.
(E) Working model on the putative mechanisms by which BTK promotes stemness and drug resistance in myeloma.

