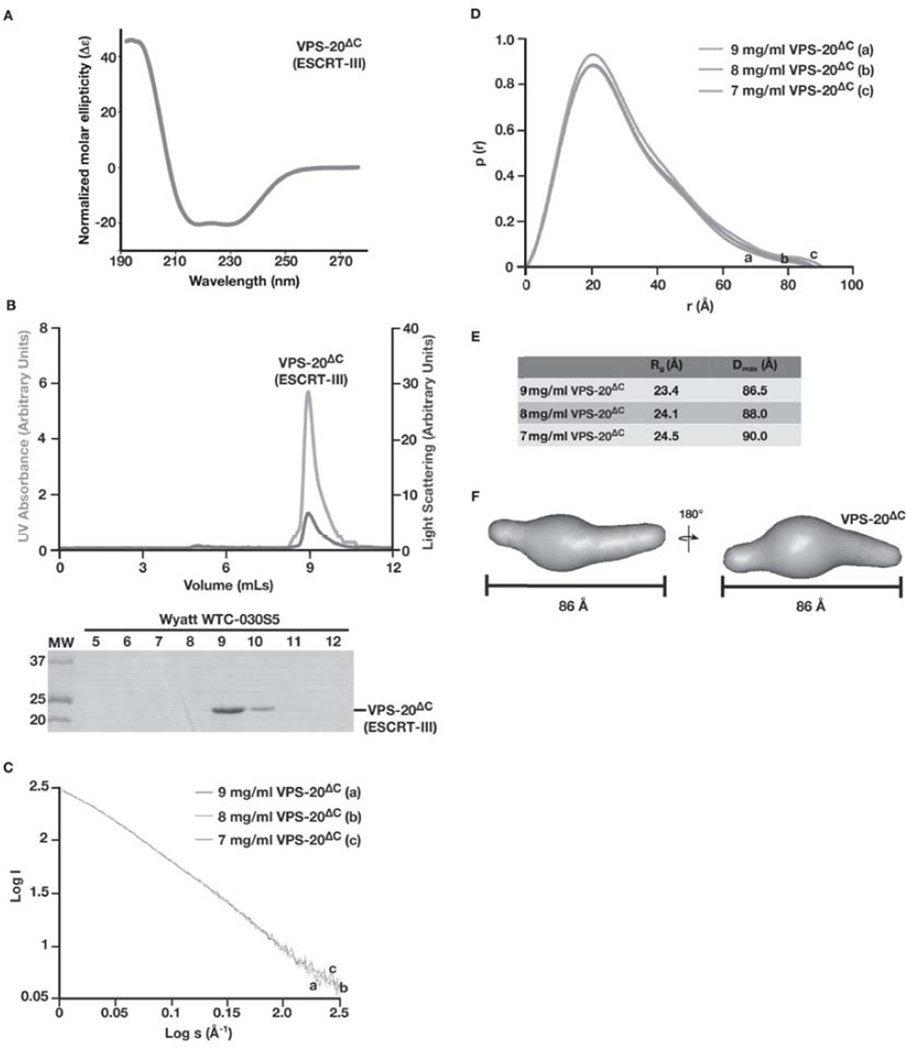
Figure 4. Analysis of C. elegans VPS-20Δc by SAXS suggests that it exhibits an extended conformation, similar to the full length protein in solution.
(A) CD spectroscopy was used to characterize VPS-20ΔC. Samples were analyzed at a concentration of 1 µM, and the data were normalized. CD spectra were collected at 25°C in 25 mM sodium phosphate (pH 7.2) using a 1 mm path length quartz cell. (B) Purified, untagged VPS-20ΔC (amino acids 1–170) was separated over a gel filtration column that was coupled to a multi-angle light scattering device. Both the UV absorbance (green) and light scattering (blue) profiles are plotted (top) and eluted fractions were separated by SDS-PAGE and stained using Coomassie to highlight the elution profile of VPS-20ΔC (bottom). (C) Log of scattered intensity vs. log of s is shown across the three concentrations of VPS-20ΔC used in SAXS experiments (9 mg/mL, 8 mg/mL, and 7 mg/mL). Plots for each concentration of protein are labeled alphabetically (9 mg/mL is denoted ‘a’, 8 mg/mL is denoted ‘b’, and 7 mg/mL is denoted with ‘c’). (D) Pair distance distribution function plots comparing the three concentrations of VPS-20ΔC used in SAXS experiments. Plots for each concentration of protein are labeled alphabetically (9 mg/mL is denoted ‘a’, 8 mg/mL is denoted ‘b’, and 7 mg/mL is denoted with ‘c’). (E) A summary of the Rg and Dmax values for the three concentrations of C. elegans VPS-20ΔC tested. (F) A low resolution, ab initio model of VPS-20ΔC was determined based on fifteen structures that were generated using the program DAMMIF and averaged with DAMAVER, resulting in a NSD value of 0.65. Two views, rotated 180° related to one another, are shown. VPS-20ΔC exhibits a Dmax of 86 Å.

