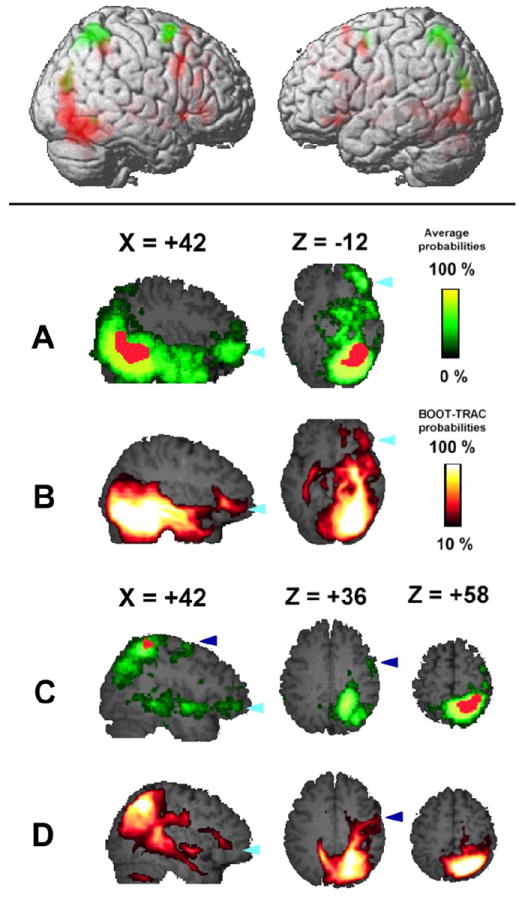
Figure 2.

(Upper panel) Activation maps superimposed on a three-dimensional brain. Areas in green were active to spatial stimuli, while areas in red were active to face stimuli during the encoding phase. The image on the left side represents the right hemisphere, and includes all activated areas with a height threshold of p < 0.001 (uncorrected). Activated areas with a height threshold of p < 0.001, corrected for whole-brain multiple comparisons at the cluster level (p < 0.01), are listed in Table 1.
(Lower panel) Group analyses (n = 15) of tractography from the right FG (A, B) and right IPS (C, D). Population maps (A, C) and BOOT-TRAC probabilistic maps (B, D) are superimposed on a T1-weighted template brain. Talairach coordinates of each section are shown on top of each panel. Red areas in the population maps (right FG in panel A, right IPS in panel C) represent activated areas in the right FG (A) and right IPS (C). The dark blue arrowheads point to areas around the right SFG, while light blue arrowheads point to areas around the right ventral IFG. See also Supplementary Table S1 and Table S2.
