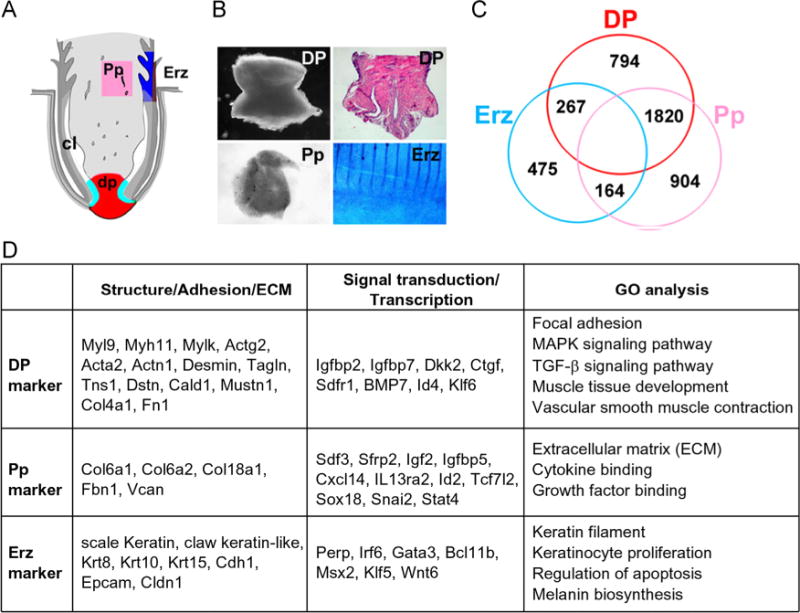
Fig.1.

Gene expression profiling in the feather follicle. (A) Diagram and (B) examples showing the feather structure and the dissection process. H&E showing the structure of the DP. Erz was illustrated based upon DAPI staining. The stripes in the Erz sample are feather branches. dp, dermal papilla; Pp, pulp; Erz, ramogenic zone feather epithelium. (C) Venn diagram showing differentially expressed genes among DP, Pp and Erz. (D) Lists of highly expressed genes in each compartment that could serve as “markers”. The gene abbreviations are according to the NCBI listings. Gene ontology (GO) analysis results are also shown.
