
Figure 4.
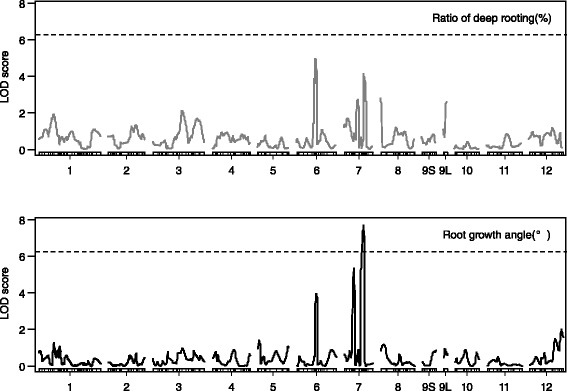
LOD score curves for the QTLs for the ratio of deep rooting and root growth angle in the KD-F2 plants. Rectangles represent linkage maps, with the DNA marker positions shown as vertical lines. Chromosome numbers are indicated under each linkage map (short arms are on the left). 9S and 9 L indicate separate linkage maps for the short and long arms of chromosome 9, respectively, for the region around DRO1 that is homozygous for Kinandang Patong. Dotted lines indicate the LOD thresholds (6.20 for both the ratio of deep rooting and the root growth angle).