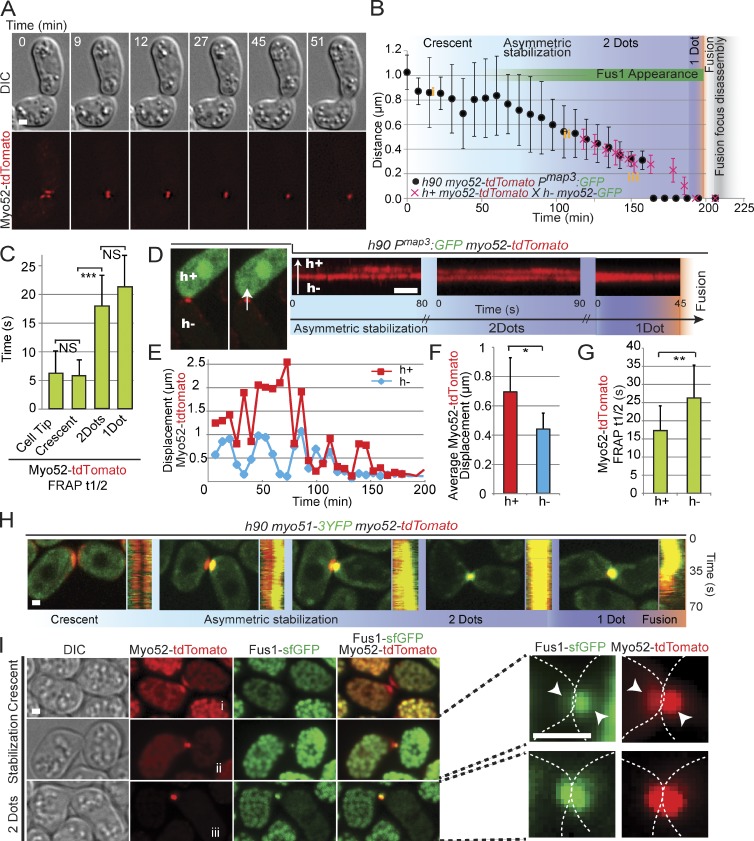
Figure 3.
Type V myosin localization and dynamics define multiple steps in the formation of the fusion focus. (A) Time-lapse images of homothallic h90 myo52-tdTomato strain. (B) Distance between Myo52 signals in the two partner cells. The black symbols show mean distances over time in h90 myo52-tdTomato Pmap3:GFP cell pairs (n = 20), aligned to fusion time. The red symbols show mean distances over time in h+ myo52-tdTomato × h− myo52-GFP (n = 20), aligned to the time of fusion focus disassembly. The two curves were then manually aligned to the time of fusion focus disassembly. The distinct phases of Myo52 localization as described in the rest of the figure are indicated; i.e., the crescent phase, the asymmetric dot stabilization phase, the two-dot phase, and the one-dot phase. Note that the one-dot phase simply indicates that two dots cannot be resolved. The length of the asymmetric phase, during which a dot is observed in the h− cell, whereas a crescent or a mobile dot is present in the h+ cell, is variable from pair to pair. The yellow i, ii, and iii refer to the distances between Myo52 structures measured in I and thus provide an indication of the timing of Fus1 appearance. (C) Mean FRAP recovery half-times of Myo52-tdTomato at the cell tip of vegetative growing cells or at indicated steps of cell–cell fusion. Homothallic h90 pairs expressing Myo52-tdTomato and Myo51-3YFP were used for this experiment to precisely monitor the appearance of the stable two-dot phase (see H). Cells with distinct, focalized Myo51 signals were attributed to the two-dot and one-dot categories. Myo52 is less mobile when localized at the fusion focus. t test, ***, P = 1.9 × 10⁻⁷; n = 15 for each category. (D) High-temporal resolution imaging of homothallic h90 myo52-tdTomato pmap3:GFP strain. The h+ cell-specific GFP expression allows to mark the two cell types. The left images show a pair with a stable focus only in the h− cell. The right images show kymographs of Myo52-tdTomato at the fusion site in different h− and h+ partner cells at distinct stages of the fusion process: during asymmetric dot stabilization, when a stable dot is present in each cell, and after the two dots have merged into one. In early stages, Myo52-tdTomato is more stable in the h− cell than the h+ cell. The arrow represents the direction of the line drawn to make the kymographs. (E) Instantaneous displacement of Myo52-tdTomato signal over the entire fusion process. The graph shows one representative mating pair. (F) Mean Myo52-tdTomato instantaneous displacement over the entire mating process (n = 8 cells). t test, *, P = 1.8 × 10⁻². (G) Mean FRAP recovery half-times of Myo52-tdTomato focus in heterothallic h− (n = 10) or h+ (n = 12) myo52-tdTomato mating cells crossed to cells expressing CHD-GFP. t test, **, P = 8.19 × 10⁻³ (H) Time-averaged projections and kymographs of h90 myo52-tdTomato myo51-3YFP cells, imaged every second over 70 s. Myo51 strongly colocalizes with Myo52 upon asymmetric dot stabilization. (I) Time-averaged projections over 2 min of h90 myo52-tdTomato fus1-sfGFP mating, imaged every 30 s. Mating pairs at crescent, asymmetric dot stabilization and two-dot stages are shown. i, ii, and iii refer to distance between dots, as highlighted in B. Right images show enlargements of the fusion site. Arrowheads point out the difference in intensity of Myo52-tdTomato and Fus1-sfGFP between both mating partners. Dotted lines show the outline of the mating pair. DIC, differential interference contrast. Bars, 1 µm. Error bars are standard deviations.

