Figure 6.
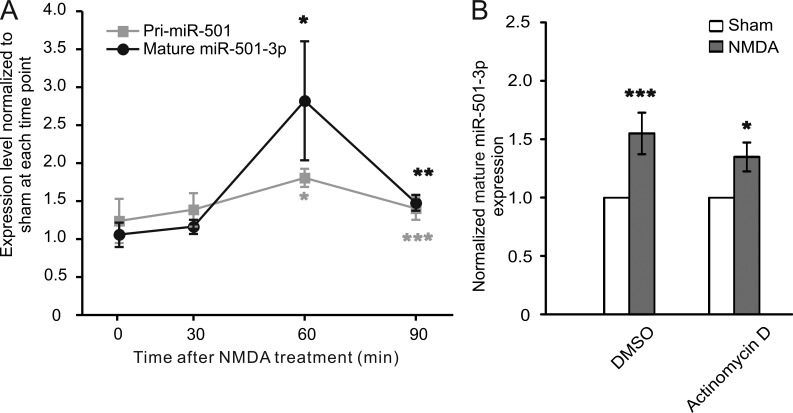
miR-501-3p expression is regulated both transcriptionally and posttranscriptionally. Cultured hippocampal neurons (17 DIV) were treated with NMDA (30 µM for 5 min) alone or along with designated inhibitors and harvested for qRT-PCR. (A) The temporal profile of pri- and mature miR-501-3p expression after NMDA treatment; the levels of pri- and mature miR-501-3p in NMDA-treated cells are normalized to and compared with those in sham-treated cells at the same time point for statistical analysis; n = 4–6 experiments for each time point. (B) The effect of actinomycin D on NMDA-induced changes in mature miR-501-3p; n = 7 experiments for each condition. Data are shown as mean ± SEM; Mann-Whitney U test was used for statistical analysis. *, P < 0.05; **, P < 0.01; ***, P < 0.005.

